The New Game of Renewable Fuels Part 4 – Rewind to June 2023, On The Brink of a RIN Price Collapse
In this blog series, we are explaining how the invention of the Renewable Identification Number (RIN) environmental credit in 2007 was a game-changing development in the fuels industry.
The RIN is a clever, sophisticated financial instrument – in fact, we have made the bold claim that the RIN alters fuels economics in ways so unfamiliar to the market that the RINs game is still being played today with little understanding of how it really works.
While the Renewable Fuels game resembles the Conventional Fuels game from a distance (as the game of bridge resembles pinochle), the fundamental rules are radically different in ways that cause non-intuitive price behavior that confuses almost any player at first.

Until you step back and make a deliberate effort to learn its peculiar rules, you will be surprised and shocked what happens in real time as you try to play one game by the rules of the other.
Read the other blogs in this series, The New Game of Renewable Fuels:
- Part 1-The Rules Of The Game
- Part 2-Three Basic Principles
- Part 3-WHY Are The Mandates Nested?
- Part 4-On The Brink
- Part 5-Changing Factors
- Part 6-Playing By The Rules
The D4 Renewable Identification Number (RIN) credit price fell from a high of $1.60 in July, 2023 to a low of $0.39 in February, 2024. Starting in May 2023, there had been chatter about the potential of a sharp decline caused by the boom in renewable diesel production – in particular, what might happen if the renewable diesel production rate exceeded the minimum mandated level specified by the Renewable Fuel Standard?
But while that was creating quite a buzz in some places, it is clear that renewable fuel industry executives, investors, and government regulators were looking at the situation as business as usual for RINs.
In today’s blog, we revisit the renewable diesel market’s reaction to the swift decline in this key credit price and explain how the D4 RIN price action compares to a theoretical pricing model based on economic fundamentals.
Recall from our Misunderstanding series that RIN credits are generated when certain types of renewable fuels are produced. The credit is part of the regulatory system that subsidizes the supply of renewable fuel components in fuels consumed in the U.S.
The RIN can be sold to producers or importers of non-renewable fuels who need them to satisfy their renewable volume obligations under the Renewable Fuels Standard. Those renewable volume obligations are, in effect, a tax on the supply of petroleum-based fuel to the U.S. market, a tax that funds the RIN subsidy.
The D4 code applies to the RIN category for renewable diesel fuel which is made from soybean oil, animal fats and used cooking oil and is sold as diesel fuel in the U.S.
Rewind to May, 2023
On May 31, 2023, Scott Irwin and Maria Gerveni (University of Illinois) and Todd Hubbs (U.S. Department of Agriculture) published an article titled Is the Renewable Fuel Standard In Danger Of Going Over a RIN Cliff?. The article estimated D4 RIN demand to be around 4.5 billion gallons per year and explained the theoretical implications of the supply rate growing to exceed that level. The article, which foretold the likelihood of a D4 RIN price crash, was the 12th in their series of articles on the boom in renewable diesel production.
In June, 2023, the first of Hoekstra Trading’s 4-part blog series named Baby the RIN Must Fall was published in the RBN Energy Daily Blog. That series emphasized that the RIN functions as a subsidy plus a tax plus a mandate, all coupled in one financial instrument which functions in a way that triggers unusual step changes in price when certain boundaries (like the “RIN cliff”) are crossed. It described the RIN cliff boundary as an “End Wall”, analogous to the boundary nicknamed the “Blend Wall” (discussed in part 3 of this series) which had caused a real mess in the fuels market in 2013, and concluded “it is not at all unreasonable to expect another real mess when we cross the threshold for biomass-based diesel”.
“it is not at all unreasonable to expect another real mess when we cross the threshold for biomass-based diesel”
George hoekstra, July 20, 2023
Figure 1 shows market prices of the D4 RIN (gold and silver data) and its theoretical value (black line) as of June 12, 2023:
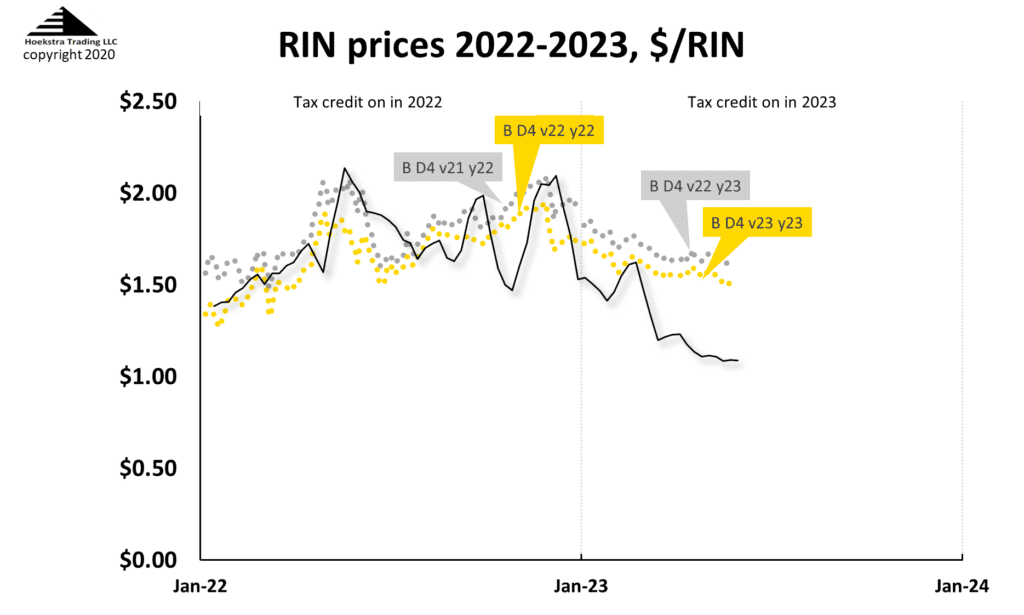
The theoretical price, D4T, is calculated in real time by Hoekstra Trading’s spreadsheet application of the D4 RIN pricing model developed by Scott Irwin (University of Illinois), Kristen McCormack (Harvard University) and James H. Stock (Harvard University). That spreadsheet is called ATTRACTOR, and the theoretical price it calculates, called D4T, is the world’s first licensed theoretical value of an environmental credit and is available with weekly updates to Hoekstra Trading clients and to Bloomberg Terminal subscribers.
The chart shows a huge gap between the market and theoretical prices of the D4 RIN in June, 2023.
Why was this D4T theoretical price so much lower than the market price through all of 2023?
Another RIN Nuance
A key reason is that the theoretical price is based on the price differential between ultra low sulfur diesel and the incremental biofuel currently competing to substitute for petroleum diesel in the diesel fuel market.
the theoretical price is based on the price differential between ultra low sulfur diesel and the incremental biofuel currently competing to substitute for petroleum diesel in the diesel fuel market.
Market participants rely almost exclusively on an empirical indicator called the BOHO spread (soyBean Oil minus Heating Oil) as the indicator of this price differential. In the past, soybean oil used in the production of FAME (fatty acid methyl ester) biodiesel was indeed the incremental biofuel for the manufacture of bio-based diesel, and therefore the BOHO spread was the most reliable single economic indicator for use in correlating the D4 RIN price.
But, with the renewable diesel boom, the adoption of lower-cost feedstocks, and improvements in renewable diesel production economics, market fundamentals have changed in ways that mean the true economically relevant spread has been lower than the BOHO spread since early 2023.
This is a good example where an empirical indicator like the BOHO spread can be extremely reliable for years but lose its relevance when economic fundamentals change. This may seem like a fine point, but, because of the unique attributes of the RIN, it is critical in this case. (More on that in a future blog post.)
In August 2023, during 2023’s second quarter earnings conference calls, renewable fuels executives were pressed on whether they were concerned about the possible impact of fast-growing renewable diesel production on RIN prices and renewable diesel margins. The collective response indicated no concern — quote: “business as usual for RINs” — from the C-suites.
When asked from the floor of a renewable fuels conference whether the possible breach of the mandate was causing any discussion or concern at the Environmental Protection Agency (EPA), the answer from the director of the agency’s fuels program was widely interpreted as a no.
Meanwhile, in the marketplace, what had been faint chatter in June turned into a loud buzz in the hallways of renewable fuel industry conferences in August and September as the D4 RIN was continuing to fall fast. The D4 RIN price drop was described by S&P Global as a “collapse driving down the whole RIN sector.”
The apparent rush to sell D4 RINs had conference attendees asking whether the D4 RIN price could fall below that of the D6 RIN (which applies to use of ethanol in gasoline). That is something that has never happened for more than a day or two at a time, and is as theoretically unlikely as someone offering to sell $5 bills for $1 each.
The decline in the D4 RIN price in August and September was accompanied by surging volumes and open interest in far-out D4 RIN futures traded on the Intercontinental Exchange (ICE), suggesting that sellers were rushing to lock in a positive RIN value for future renewable diesel production. Volumes for ICE D4 RIN futures soared to 15 million in August, up from 4 million contracts in July.
The gap shown in Figure 1 between the gold data and black lines provided a trading opportunity for those with confidence in the fundamental economic theory applied in ATTRACTOR and a belief that true economic value will win the day. The trade was to short the D4 RIN, which can be done a couple of ways.
Well-informed RIN traders did that in early 2023 to capitalize on an indicated mispricing versus true economic value, and that strategy paid off handsomely for them with the subsequent price drop shown highlighted in Figure 2, with data updated to today:
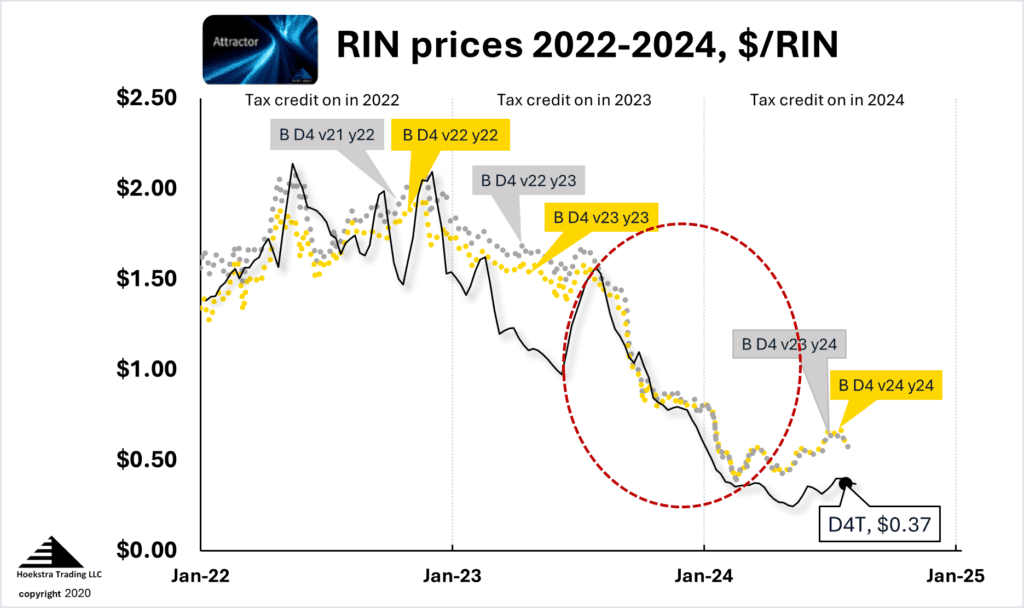
A little-known nuance of the RIN system is that improvements in the inherent economics of renewable diesel production, instead of improving renewable diesel industry margins, reduce the subsidy received by renewable diesel producers via a corresponding reduction in the value of the RIN.
The RIN price crash highlighted in Figure 2 is a consequence of that nuance. It was foreseeable, foreseen, and predicted by those with the benefit of a fundamental model of the quirky economics that govern RIN prices.
Recommendations
1) Get Hoekstra Research Report 10
Hoekstra Trading clients use the ATTRACTOR spreadsheet to compare theoretical and market RIN prices, analyze departures from theoretical value, and identify trading opportunities on the premise RIN market prices will be attracted toward their fundamental economic values.
Get the Attractor spreadsheet, it is included with Hoekstra Research Report 10 and is available to anyone at negligible cost.