The New Game of Renewable Fuels Part 5 – Changing Factors
In this blog series we are explaining how the invention of the renewable identification number (RIN) environmental credit in 2007 was a game changing development in the fuels industry.
The RIN is more than just an environmental credit. It is a cleverly designed financial instrument. In fact, we claim it changed the fuels game in ways so unfamiliar to the market that the big players, still today, have little understanding how it really works.
While the renewable fuels game resembles the conventional fuels game from a distance (as the game of bridge resembles pinochle), the fundamental rules of the game are different in ways that cause radically different price behavior that confuses any player at first.

And until you step back and make a deliberate effort to learn its peculiar rules, you will continue to be surprised and shocked as you continue to play this game in real time by the rules of the other game with which you are so familiar.
Read the other blogs in this series, The New Game of Renewable Fuels:
- Part 1-The Rules Of The Game
- Part 2-Three Basic Principles
- Part 3-WHY Are The Mandates Nested?
- Part 4-On The Brink
- Part 5-Changing Factors
- Part 6-Playing By The Rules
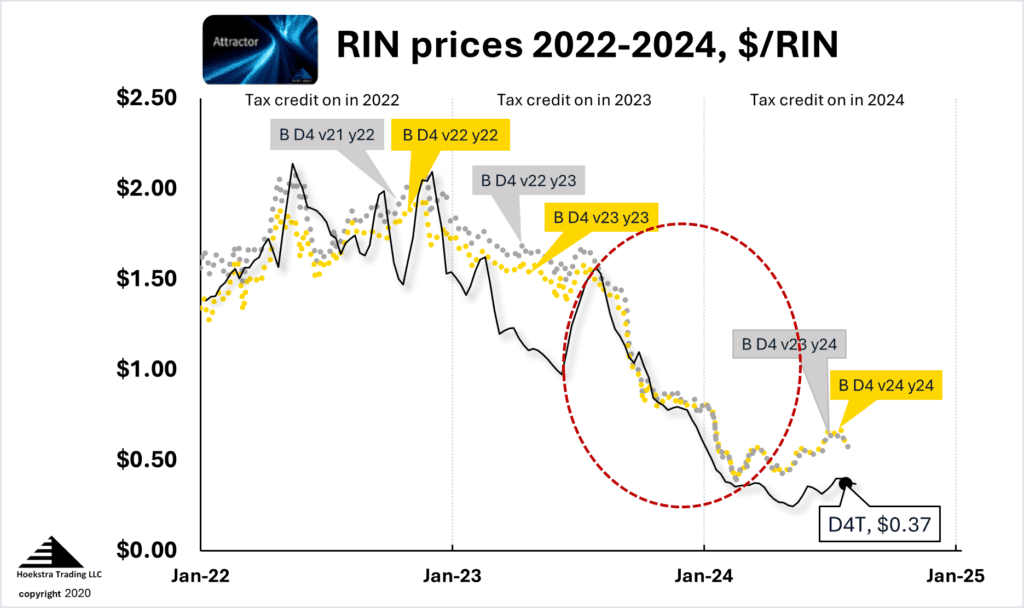
Last weekend’s episode gave a play-by-play review of the run up to the 2023 RIN price crash, and the crash itself, which brought the D4 RIN market price down from $1.60 in June 2023 to $0.40 in February 2024.
How did that crash affect a representative renewable diesel producer’s margin? Let’s run the numbers.
Margin factors
Figure 1 shows the factors in the margin picture as of June 2023 for a plant making renewable diesel from soybean oil for sale in California. Starting at the far left, the revenue was $1.90/gal from the sale of one gallon of renewable diesel (as a pure substitute for petroleum-based ultra low sulfur diesel (ulsd), renewable diesel sells for the same market price as the ulsd it displaces).
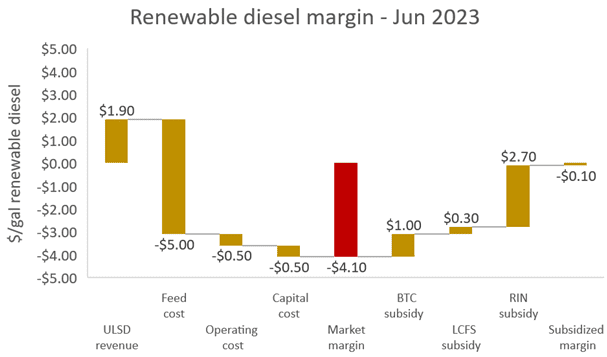
The cost of the soybean oil needed to make that gallon of diesel fuel was $5.00. An operating cost of $0.50/gal and capital cost of $0.50/gal brought the “market margin”, indicated by the middle red bar, to negative $4.10/gal.
That is what we call “upside down” economics. By free market standards, this is a really unattractive business. In the absence of subsidies, its cost to produce is more than triple the market value of its product.
In the absence of subsidies, this plant’s cost to produce is more than triple the value of its product.
The three subsidies are shown to the right of the red bar. They are the U.S. federal blender’s tax credit (BTC) of $1.00/gal, the California Low Carbon Fuel Standard (LCFS) subsidy of $0.30/gal, and the RIN subsidy (by rule, that equals 1.7 times the D4 RIN price = 1.7 x $1.60 = $2.70/gal). The subsidies add to $4.00/gal which means the plant’s bottom line margin, after subsidies, was negative $0.10/gal.
Figure 1 shows how heavily this renewable diesel business relies on huge government subsidies as the foundation of its profitability.
After the Crash
Figure 2 shows the effect of the RIN price crash by comparing the June 2023 to the February 2024 margin factors. In that time, the market price of diesel fuel went up by $0.80, raising the plant’s revenue from $1.90 to $2.70/gal.
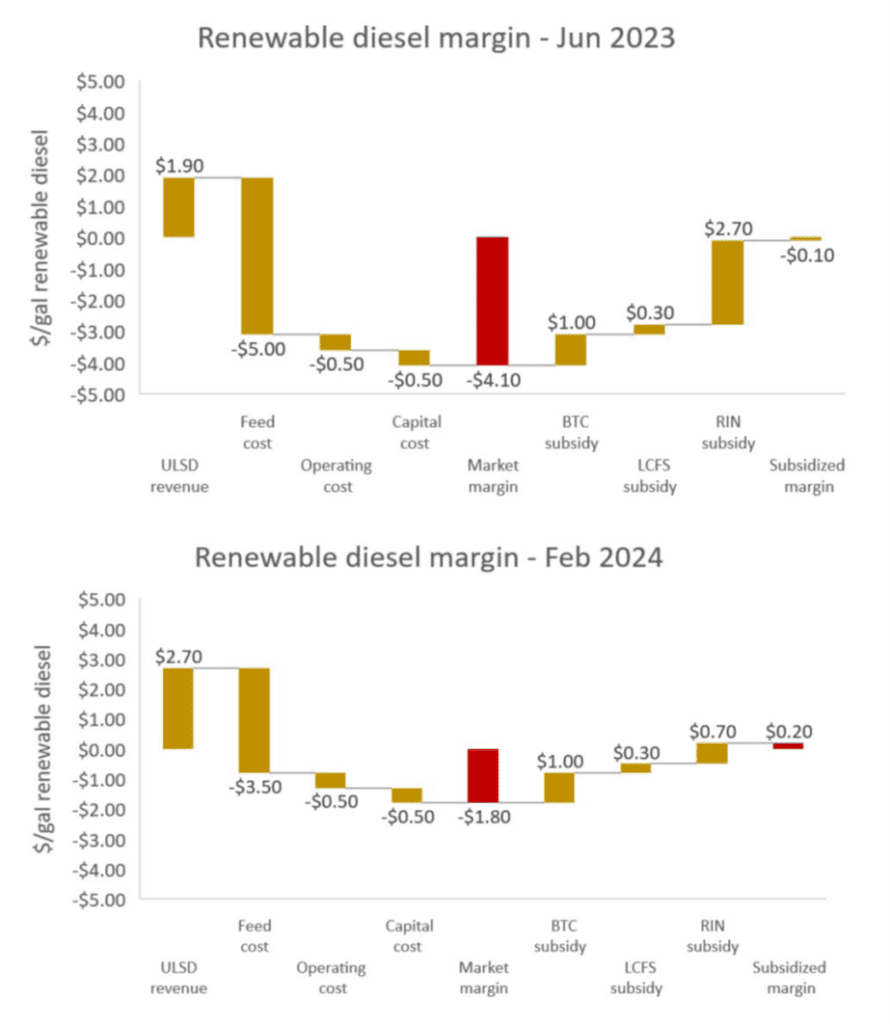
The cost of the soybean oil feedstock needed to make that gallon went down from $5.00 to $3.50, which is another $1.50 margin improvement.
So together that’s a $2.30 margin improvement which should mean the plant’s total margin improved from negative 10 cents to a nice fat $2.20 right?
Right, in a conventional free market – but wrong in the renewable diesel market because, as shown on the right side of Figure 2, the value of the RIN subsidy crashed from $2.70 to $0.70, wiping out almost all the gain in free market margin, leaving the plant with only $0.20/gal bottom line margin.
Why did the RIN price drop so much? That was by design. It is harder to explain than the above margin analysis because of the complexity of the RIN system. It is explained in detail in Hoekstra’s RBN Energy blog series Misunderstanding, The Big Bang Theory, Baby the RIN Must Fall, and Upside Down.
But a faster and better way to learn it is to purchase Hoekstra Research Report 10 which will give you a firm grip on it so you can foresee, anticipate, and play the Renewable Diesel game in ways that greatly improve your success.
Changing factors
Because of the RIN price crash, 2024 quarterly earnings reports have been disappointing so far for renewable diesel producers. Producers are citing long lists of changing factors that are expected to affect profit margins over the coming years. They are correctly anticipating a volatile market environment.
There is a long list of changing factors.
Here is another look at Hoekstra Trading’s ATTRACTOR spreadsheet chart which was shown in last weekend’s blog post. It shows D4 RIN market prices in gold and silver and the theoretical value D4T, which is the world’s first licensed theoretical value of an environmental credit, in black. This chart also highlights the 2023 RIN price crash with a red oval.
Hoekstra Trading clients always have an informed view of the most probable RIN market price direction. And they know exactly how the D4T theoretical price would be affected by all the changing factors, and why.
For example, how sensitive is D4T to changes in:
- California’s LCFS credit price?
- Federal producer subsidies?
- The mandated renewable fuel volume obligations?
- –
- –
- –
ATTRACTOR gives industry-best quantitative answers and explanations, grounded in economic fundamentals, that users can quickly estimate and display by changing input values on the spreadsheet controls.
Another way to see those sensitivities is to ask, how big a change in each factor would be needed to fully reverse the 2023 RIN price crash? Some factors are highly sensitive in that way. But the most cited factors are not among the most sensitive factors.
For example, the most cited factor is the mandated renewable volume obligation. But given today’s industry structure, that is not a high-sensitivity factor. It is highly unlikely changes in it alone will restore industry profitability to anything near pre-crash margins.
Recommendation
Get Hoekstra Research Report 10
Hoekstra Trading clients use the ATTRACTOR spreadsheet to compare theoretical and market RIN prices, analyze departures from theoretical value, and identify trading opportunities on the premise RIN market prices will be attracted toward their fundamental economic values.
Get the Attractor spreadsheet, it is included with Hoekstra Research Report 10 and is available to anyone at negligible cost.