Why The Gap Between the D4T Theoretical Price and D4 RIN Market Price?
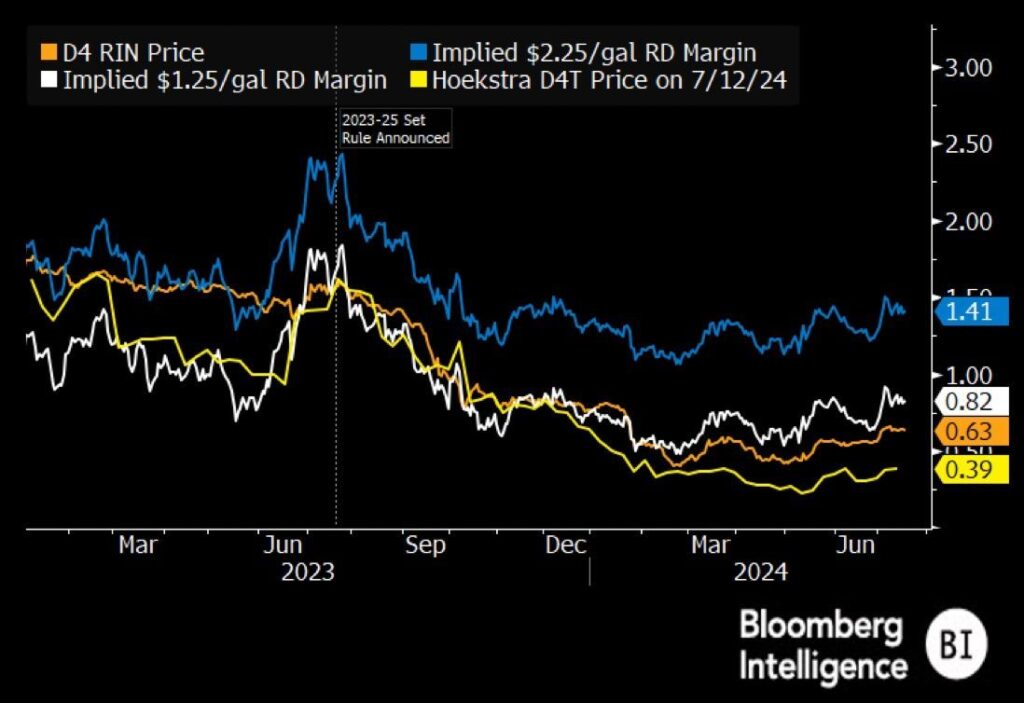
I have been asked how the D4T theoretical price (yellow line in Figure 1) is calculated and why it is lower than the D4 Renewable Identification Number (RIN) market price (orange line).
D4T is calculated in a spreadsheet called ATTRACTOR using the model derived in this article.
In the past year, the D4 RIN market price has been mostly bouncing off D4T from above, most recently in February 2024 at a price of $0.42. D4T, shown here at $0.39 on July 12, 2024, has not changed much since February. We of course know why that is because we calculate D4T every week. The reason D4T hasn’t changed much is because, in that time, there’s been little change in the fundamental economic variables and parameters that determine D4T.
So that leaves the question, why has the D4 RIN market price gone up from $0.42 to $0.63 in that time? What changes in RIN price fundamentals could have caused that? Hoekstra Trading clients discuss questions like that when interpreting price behavior and deciding RIN strategy. The D4T value gives a sound, quantitative, theoretical reference point, and ATTRACTOR gives an easy way to quantitatively test theories for the differences between the market and theoretical prices.
For example, is the market foreseeing a coming increase in the Renewable Volume Obligation mandates, an increase big enough to justify the RIN being 50% higher than D4T? That theory can be tested quantitatively and ATTRACTOR says it is an unlikely explanation because it would take an unusually large increase in the mandates to explain this 50% difference.
Similarly, with ATTRACTOR, you can quantitatively test other theories on what might explain the gap — is the market pricing in coming changes in the Blender’s Tax Credit? The Clean Fuel Production Credit? The ramp up rate of renewable diesel production? The future price of diesel fuel? The prices of renewable feedstocks? The other parameters that affect the D4 price? – with ATTRACTOR, these sensitivities are easily tested, not just directionally, but quantitatively – how big a change in each factor would be required to explain the gap? And then you can assess whether a change that big is likely to happen.
We have been using ATTRACTOR like that since 2020. It is not uncommon for the D4 market price and D4T to deviate. We analyze the deviations. The historical tendency is for the market price to be attracted toward D4T in the long run. You can see that tendency in the empirical testing described in the above-referenced article going back 13 years, and that has been our observation too as we’ve used ATTRACTOR 4 years in real time.
Recommendations
1) Get The ATTRACTOR Spreadsheet
It includes a report and 6 months of unlimited assistance by phone and E-mail. Hoekstra Trading clients use the ATTRACTOR spreadsheet to compare theoretical and market RIN prices, analyze departures from theoretical value, and identify trading opportunities on the premise RIN market prices will be attracted toward their fundamental economic values.
Get the Attractor spreadsheet, it is included with Hoekstra Research Report 10 and is available to anyone at negligible cost.