RINs And Stock Prices – Are They Connected?
The current renewable diesel boom was triggered by $billions of investment whose financial success relies on government mandates, credits, and subsidies, primarily the Renewable Fuels Standard and its Renewable Identification Number (RIN) credit system.
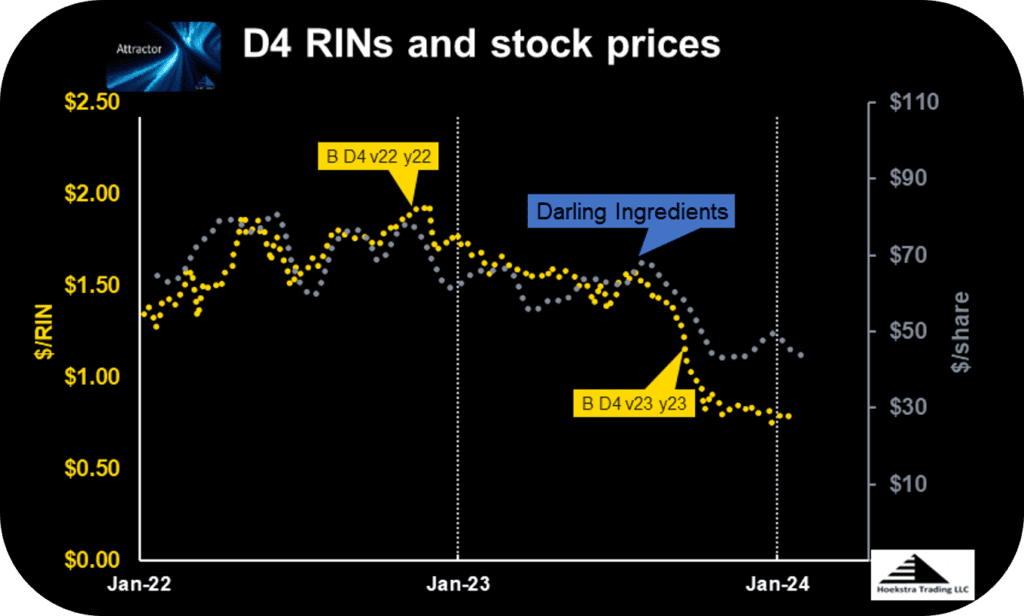
Hoekstra Trading has studied relationships between RINs and stock prices since 2020 and reported on them in our annual Research Reports. As one example, Figure 1 shows a relationship between the prices of the D4 RIN and Darling Ingredients’ stock (DAR). Is this a cause-and-effect, or a chance relationship? There are good reasons to believe it is cause-and-effect.

Figure 1: D4 RIN and Darling Ingredients stock price Source: Barchart.com and Hoekstra Trading LLC
The RIN is a complex financial instrument. It is, at once:
- a tax
- a subsidy
- a mandate
- a part of a larger nested mandate system
- a bankable asset
- a liability
- a contingent claim
- a wasting asset
It is a financial derivative whose value derives from and depends on the prices of other commodities.
Like some other derivatives, the theoretical price of a RIN can be quantified using options pricing theory. And it has been proven that theory works well for this purpose.
RIN models
In last week’s blog post, I described the RIN system as a price control system, analogous to other control systems with multiple parts like relief valves and circuit breakers set to activate at preset limits with sometimes shocking effects. Like other control systems, the RIN price control system can be described by a model consisting of equations and diagrams.
One model of the RIN system consists of 26 equations and 26 unknowns. When you solve that system of equations, you get the production rate and price of every stream and every RIN in the system. It even predicts the Big Bang, which is our name for the 100-fold (that’s 100-fold, not 100%) increase in the D6 RIN that occurred in 2013 when the quantity of ethanol in E10 gasoline hit the “blend wall”, a preset limit that is defined as a boundary in one of the 26 equations.
Attractor and D4T
Hoekstra Trading’s Attractor spreadsheet calculates the price of D4 RINs using options pricing theory. The model assumes perfect competition among market participants who produce, buy, sell, and trade to maximize their profits.
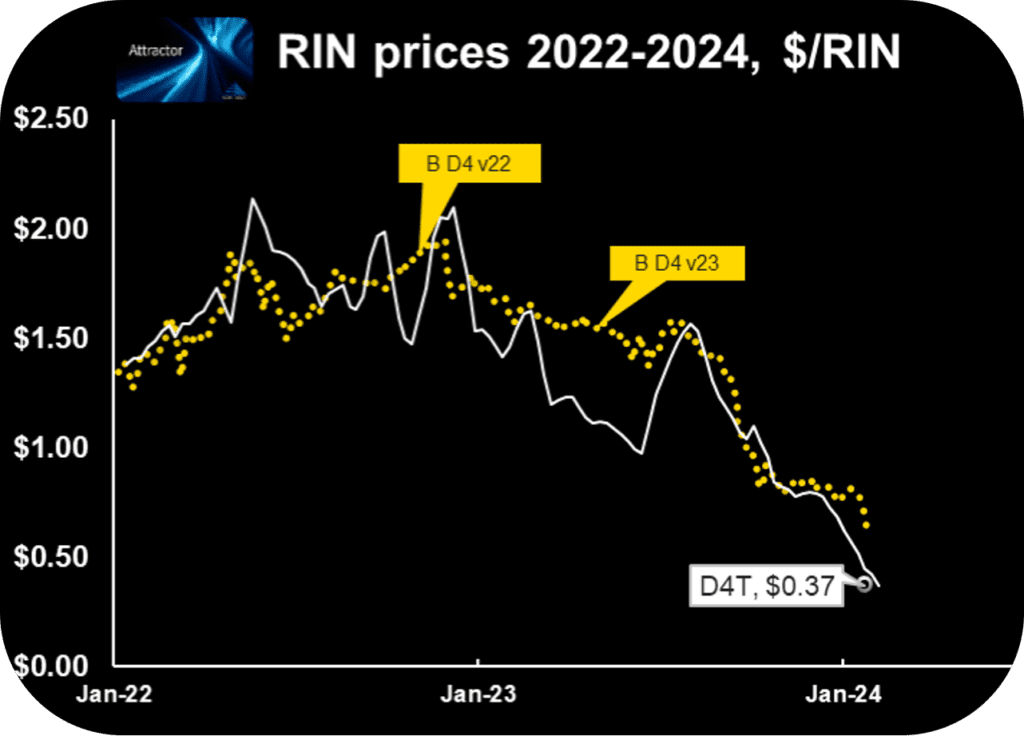
After 3 years of successful use, we named this spreadsheet Attractor. We observed that, while D4 RIN market prices often deviate substantially from the calculated theoretical price (which we named D4T), they tend to be attracted toward D4T eventually. That is what happened last year when the RIN price nosedived by 50% in a short time, an event that was foreseeable, and was foreseen by Hoekstra Trading clients using Attractor.
D4T provides a useful, quantitative reference price for those wanting to understand, interpret, or anticipate market price movements, or those whose financial or other forms of well-being depend on the price of the D4 RIN.
Land of confusion
Given the complexity of the RIN price control system, it is not surprising there is widespread confusion about RIN price behavior.
Like other control systems, the only way to really understand it is with the help of the equations and diagrams that describe the full system. If you focus on one part of the system to the exclusion of others, you risk missing important effects caused by the interacting parts.
For example, if you see the RIN as simply a tax, or simply a subsidy, or simply a mandate, you are working with a surface level understanding that is missing important parts of the picture. If you do that, or if you rely on intuitive feel without applying economic principles, you risk being blindsided.
What is surprising (to me) is that RIN market participants have tolerated for so long (15 years now) the widespread confusion and contradictions that still surround RIN price behavior. That’s why I said, in last week’s blog post:
Considering the importance of RINs to their financial results and stock prices, why hasn’t someone in a C-suite, or a leader among their subordinates, demanded that someone in their organization be relieved of his normal duties for a few months and dedicate himself to the full-time study of RIN pricing and economics until he understands it at a deep, fundamental level, and can explain it in an understandable way to those in the C-suites and others who badly need access to that deep fundamental understanding?
George hoekstra
That would be a good thing to do. But it appears it has not been done by anyone involved in making the billion dollar capital investments driving the current boom.
In 2020, frustrated by the never-ending confusion and contradictions surrounding “RINsanity”, I did it myself. So it is no longer necessary for C-Suites and investors to accept surface level understanding of RIN price theory.
Getting down to basics
I know refining leaders do not accept failure to understand the behavior of critical refining process units or the systems that control them (thank goodness!). In a refinery, if you get blindsided by something important because you were working with surface level understanding, or going by intuitive feel, it will be considered a failure and, if you are lucky, you will be required to go back and learn about it, even if that requires some study that involves reference to equations and or diagrams, which are readily available.
Similarly, leaders of renewable diesel companies should not accept failure to understand the behavior of the critical price control system that under-girds the success of their billion dollar capital investments, even if that requires some study and reference to equations and diagrams, which are readily available.
Returning now to the topic of stock prices of renewable diesel producers, we know their stock prices depend on things like effective feedstock acquisition, operations excellence, high value products, and good financial management. Their leaders do not accept surface-level understanding of those critical aspects of their business performance.
Similarly, from charts like Figure 1, it is evident their stock prices also depend critically on the RIN price control system, and it follows that their leaders and shareholders should no longer accept surface-level understanding of RIN pricing and economics.
Recommendation
You should get Hoekstra Research Report 10 which includes 6 months of unlimited consultation and the Hoekstra Attractor RINs pricing spreadsheet that accurately calculates theoretical RIN prices, tracks actual prices, and predicts how RIN prices will change with the variables that affect them and is available to anyone immediately at negligible cost. Why not send a purchase order today?
Anyone with a stake in RINs pricing and economics should get Hoekstra Research Report 10
Attractor update

The Attractor spreadsheet shows the D4 RIN market price (gold points) and the “D4T” theoretical value (white line and open white data point) updated through last Friday. The theoretical value of a hypothetical D4 RIN with 1 year remaining life (“D4T”) is $0.37 which is down 10 cents from last week.

Hoekstra Trading clients use this spreadsheet to compare theoretical and market prices, analyze departures from theoretical value, and identify trading opportunities on the premise RIN market prices will be attracted toward their fundamental economic values.
Get the Attractor spreadsheet, it is included with Hoekstra Research Report 10 and is available to anyone!

George Hoekstra george.hoekstra@hoekstratrading.com +1 630 330-8159
