Hoekstra Trading RINs price spreadsheet model
This chart shows, in green, the price of D4 RINs traded from 2011 through March 2021:
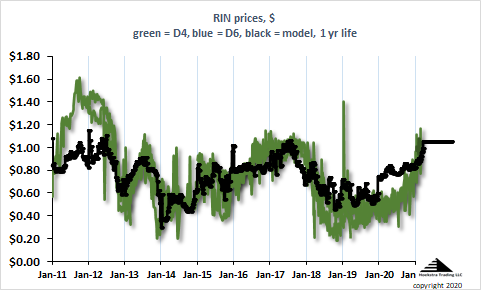
The black line represents a theoretical pricing model for the D4 RIN developed by professors at The University of Illinois and Harvard University. Their modeling work shows the D4 RIN price responds in a rational way to changes in the fundamental economic variables that determine its value. I call this the IMS model which is an acronym for the authors’ names.
Hoekstra Trading has implemented the IMS model in a spreadsheet which also contains all historical RIN price data from 2011- March, 2021. The spreadsheet is available to anyone.
There is no such thing as THE price of a D4 RIN. At any time, there are four different D4 RINs trading at different prices. For each category of D4 RIN, trades occur over a range of prices. There is not sufficient liquidity or transparency to know the actual market price in real time. The distinct line charts and tight quotes we see in trade media do not represent actual prices at which trades are or can be made. They are more like list prices for houses, starting points to open discussions.
Here is a blowup of the 2018-2019 segment of the above chart:
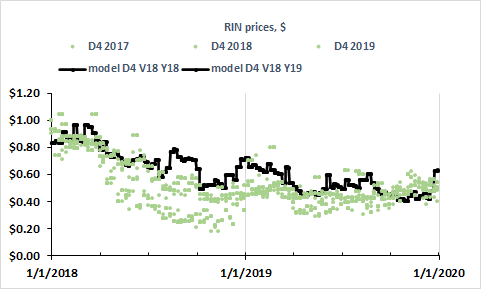
The green dots show the wide range of prices over which actual trades occurred. During this period, the black line, representing the IMS model, was generally predicting higher prices.
This next chart is the same, but only data for the 2018-vintage D4 RIN are shown. Removing other D4 categories eliminated much of the scatter in the green data. And, for this chart, the IMS model is calculated for just that specific D4 RIN, meaning the model is evaluated using actual time remaining before expiration of that particular D4 RIN. It shows a clearer relationship to the IMS model, providing insight on what is really driving D4 prices. This shows the importance of understanding the fundamental factors that affect the values of different RINs you might want to buy or sell and the prices at which you should trade them. Without this, you might easily pay double what you should.
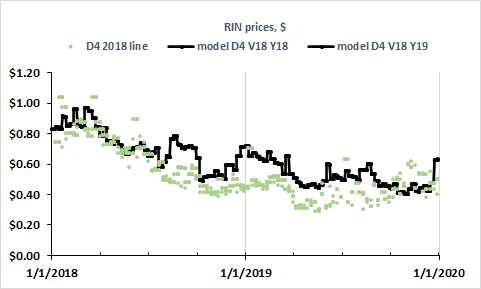
The parameters of the IMS model are easily adjusted in this spreadsheet to understand, study, interpret, and predict RIN price changes for different scenarios, and improve the profitability of RINs trading.
Recommendation
Anyone with a stake in RINs pricing and economics should get Hoekstra Research Report 10 which includes the Hoekstra ATTRACTOR spreadsheet spreadsheet that accurately calculates D4T, the theoretical RIN price, tracks it versus quoted market prices, and predicts how RIN prices will change with the variables that affect them. Why not send a purchase order today?
George Hoekstra george.hoekstra@hoekstratrading.com +1 630 330-8159
Anyone with a stake in RINs pricing and economics should get Hoekstra Research Report 10