Under the Hood of the ATTRACTOR RIN Price Model Part 1 – How to Foresee Otherwise Surprising Price Behavior
See the other posts in this series: Under the Hood of the ATTRACTOR RIN Price Model:
- Part 1 How to foresee otherwise surprising price behavior
- Part 2 Why renewable diesel margins collapsed
- Part 3 A thought experiment on profit margins
- Part 4 ATTRACTOR and the Burkholder memo
Hoekstra Trading’s ATTRACTOR spreadsheet was released in 2020. It uses this diagram of the diesel branch of the Renewable Identification Number (RIN) price control system. NOTE: THE NUMBERS SHOWN IN FIGURE 1 ARE HYPOTHETICAL.
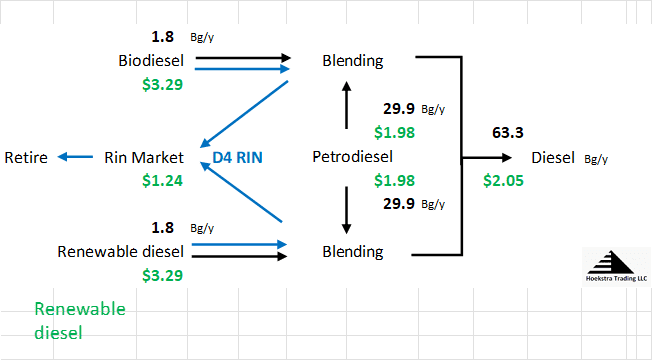
If you were a chemical engineer looking at Figure 1, you would instinctively start drawing circles around the “units” and writing down “material balance” equations for the flowing entities, which in this case are fuel streams, RINs and dollars. Economists would call those same equations “market clearing conditions”.
If you were an economist looking at Figure 1, you would instinctively start drawing supply and demand curves on charts of price versus flow rate, and find where they intersect. Chemical engineers would call those same curves “property relationships”.
Material balances are equations that state the conservation of entities that are conserved in a process. In a competitive fuel market under the control of the RIN, they include the gallons of fuels, dollars, and gallons of ethanol-equivalent RINs.
Property relationships are typically shown in charts that define properties of those entities. In this system, they include, for example, the heating values of the fuels, the prices and elasticities of supply and demand for the flowing streams.
Combining the know how of the engineer and economist enables derivation of the fundamental economic model of the D4 RIN price control system implemented in the ATTRACTOR spreadsheet that was released in 2020. We write down a set of equations, in an equal number of unknowns, that can be solved for the unique set of values for the flow rates and prices of the physical streams, dollars, and RINs flowing through the process, for a given set of input values.
One output from that model is D4T, the world’s first licensed theoretical value of an environmental credit.
After the system is solved, if you vary the values of the variables and input parameters you will observe otherwise surprising responses, like the 2023 D4 RIN price crash, and many others before they occur. That’s because these otherwise surprising price behaviors fall out of the system of equations as non-intuitive, logical outcomes of the design of the system.
Paper simulations with this model, based on engineering and economic fundamentals, allows you to reliably foresee, understand, and anticipate otherwise surprising price behaviors which have historically confused and blindsided those without the benefit of a fundamental model like ATTRACTOR. It is better to foresee, understand, and anticipate otherwise surprising price behaviors in paper simulations before they occur, in instead of after they occur in real life.
Conclusions:
- The complexities of the RIN system can be understood with the help of the fundamental model of the RIN price control system shown in Figure 1.
- Without this model, participants in the RIN markets continue to be confused by those complexities.
- The ATTRACTOR spreadsheet gives a huge competitive advantage to those who use it.
Recommendation Get Hoekstra Research Report 10
Hoekstra Trading clients use the ATTRACTOR spreadsheet to compare theoretical and market Renewable Identification Number (RIN) prices, analyze departures from theoretical value, and identify trading opportunities on the premise RIN market prices will be attracted toward their fundamental economic values.
Get the Attractor spreadsheet, it is included with Hoekstra Research Report 10 and is available to anyone at negligible cost.