Under the Hood of the ATTRACTOR RIN Price Model Part 3 – A Thought Experiment on Profit Margins
See the other posts in this series: Under the Hood of the ATTRACTOR RIN Price Spreadsheet:
- Part 1 How to foresee otherwise surprising price behavior
- Part 2 Why renewable diesel margins collapsed
- Part 3 A thought experiment on profit margins
- Part 4 ATTRACTOR and the Burkholder memo
The black arrows on Figure 1 show biodiesel and renewable diesel being blended with petrodiesel for sale into the wholesale diesel market. The blue arrows show Renewable Identification Number (RIN)s that, upon introduction to the fuel supply, are separated and sold into the RIN market for cash.
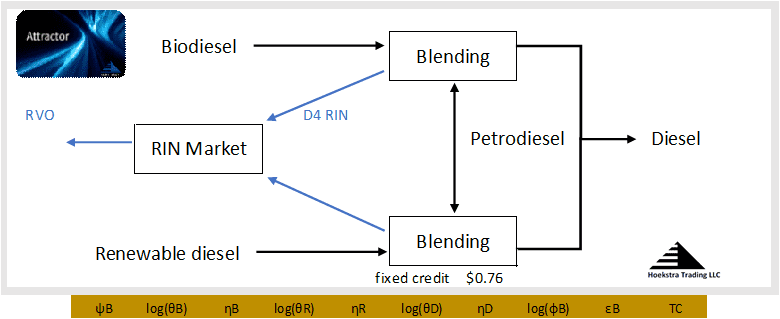
This case assumes a fixed credit of $0.76/gal, shown below the renewable diesel blending box, which also applies to the biodiesel leg. This represents the assumed value of the Biodiesel Blender’s Tax Credit and/or the new Clean Fuels Production Tax Credit over the life of the RIN.
The ATTRACTOR spreadsheet solves a system of equations describing the conditions that apply in this scheme assuming fuel markets are competitive (see parts 1 and 2 of this series for details). The outputs are the theoretical flow rates and prices of the fuels and RINs.
Figure 2 shows the computed prices for this case in which we are assuming the marginal biodiesel and renewable diesel producers have the same feed and production costs.
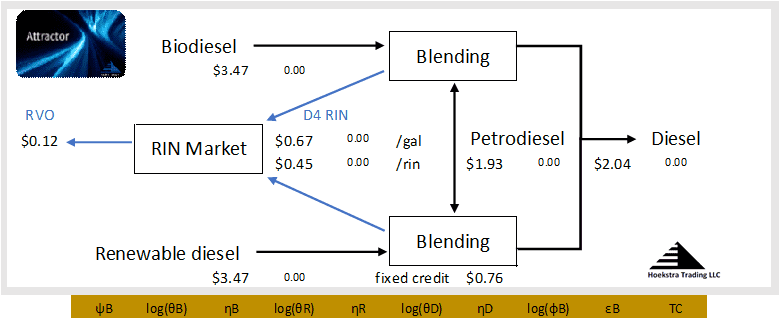
In this case, the prices of both biodiesel and renewable diesel are $3.47. The wholesale price of blended diesel, shown on the right, is $2.04/gal. The price of petrodiesel is $1.93/gal. RIN prices are shown in $/gal and $/RIN, which are different because more than 1 RIN is earned per gallon.
Profit margins
What are the suppliers’ profit margins? The petrodiesel supplier (who also sells directly into the diesel market) gets the $2.04 sale price minus his $1.93 cost of production, which seems like an $0.11 profit, except he is obligated to pay the renewable volume obligation of $0.12 (shown on the far left) which leaves him breaking even to within rounding error.
The renewable diesel producer gets the $2.04/gal sale price, plus the $0.76 fixed credit which adds to $2.80, plus the $0.67/gal RIN value, for a total revenue of $3.47 which equals his cost, so he breaks even too, and the same is true for the biodiesel supplier.
All three suppliers break even because they represent the marginal suppliers in competitive markets and these are the prices that fall out of the theoretical equations that essentially state that condition.
Spreadsheet-assisted thought experiment
Now we will relax the assumption that the biodiesel and renewable diesel suppliers have the same economics. What would happen to these prices if there was a breakthrough in biodiesel production technology that reduced the net operating cost of biodiesel suppliers by $0.04/gal?
We change the value of 1 parameter and ATTRACTOR runs the numbers to display Figure 3:
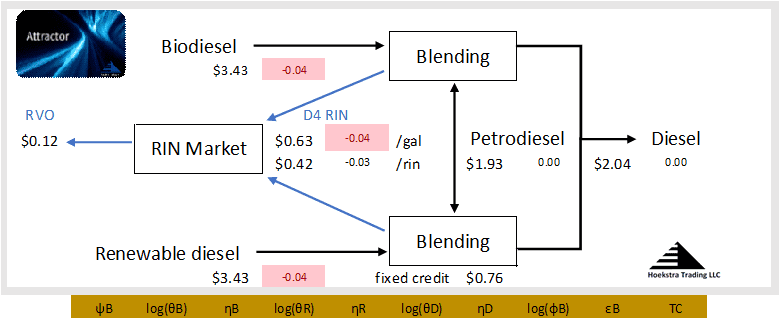
The prices of biodiesel, renewable diesel and the D4 RIN all go down by 4 cents, as indicated by the red cells showing the changes from the original case. There is no effect on the prices of petrodiesel or diesel sold into the market.
This outcome may not be immediately evident to someone trying to work it out in their head. It raises several questions. For example:
- The biodiesel producer’s price fell by the same amount as his production cost. Why doesn’t the biodiesel producer’s margin improve by virtue of the cost reduction?
- Why would a lower production cost for biodiesel also reduce the renewable diesel price?
- What is the mechanism by which the RIN price “automatically” fell by $0.04 when the cost of biofuel production went down?
- Why is there no effect on the price of diesel sold into the market?
The short answer is because this is not a free competitive market – it is a distorted market under the firm grip of a clever price control system with complex rules that introduce complexity and confuse those accustomed to free market rules (which means most people).
The good players have developed competence in playing this distorted game, which is the real-world game of today and of the foreseeable future.
All evidence suggests that, If you try to work out this thought experiment in your head, you will probably come up with different answers. In the past, these price responses could be estimated reliably using real-world experience and intuitive feel. Today, like many other business issues, it is best estimated with the assistance of a model that describes the real-world system of today,
More to come on this.
Conclusions -Complexity, confusion, and competence
- The RIN system is complex. There’s no way you can figure out the interacting effects of all the moving parts in your head.
- Unlike simple fixed credits and taxes, The RIN is a variable credit and a variable tax that controls prices in confusing ways.
- ATTRACTOR helps its users build competence and master the peculiar, non-intuitive behaviors of RIN-controlled fuel markets to avoid being blindsided by strange price responses.
Recommendation Get Hoekstra Research Report 10
It includes the ATTRACTOR spreadsheet which calculates D4T, the theoretical value of a D4 RIN, using economic fundamentals. Hoekstra Trading clients use the ATTRACTOR spreadsheet to compare theoretical and market Renewable Identification Number (RIN) prices, analyze departures from theoretical value, and identify trading opportunities on the premise RIN market prices will be attracted toward their fundamental economic values.
Get the Attractor spreadsheet, it is included with Hoekstra Research Report 10 and is available to anyone at negligible cost.