Comparing Theoretical and Market Renewable Identification Number (RIN) Prices Part 2 – How Well Do RIN Market Prices Track With Economic Theory?
How well do RIN Market Prices Track With Economic Theory?
Read other blogs in this series – Comparing Theoretical and Market RIN Prices:
- Part 1 Three Factors
- Part 2 How Well Do RIN Market Prices Track With Economic Theory?
- Part 3 Anticipating Changes in Tax Subsidies
- Part 4 Over-reacting to Regulatory Policy Changes
- Part 5 RIN Price Forecasting
This question is best answered by the 2 charts below. Figure 1 (whose title says Fig. 2) shows a copy of Figure 2 extracted from the published Irwin-McCormack-Stock (IMS) article that defines D4T and the ATTRACTOR model.
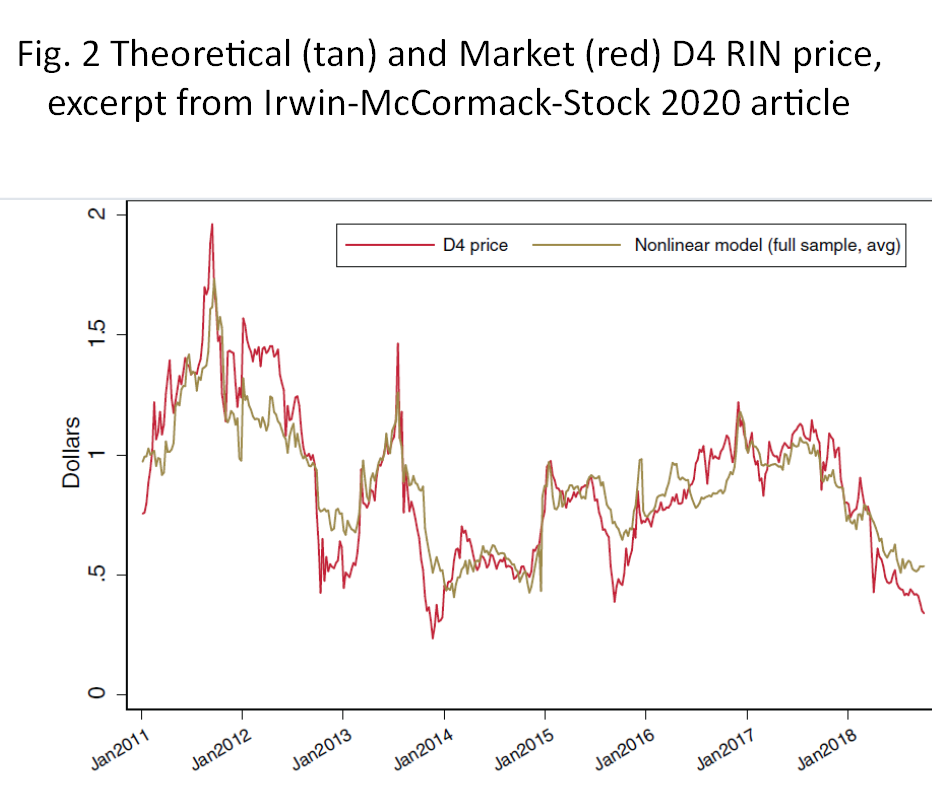
It shows the D4 RIN theoretical (tan) value tracks the D4 RIN market (red) price well, far better than any other RIN model or any credible RIN price forecasting method of which I am aware.
Nevertheless, there are frequent gaps between the theoretical and market prices. If you look carefully, the gaps between the tan and red curves are often substantial, and continue for periods of up to one year.
If you read the IMS article and study Figure 2 in more granular detail, as Hoekstra’s client group first did in 2020, you can extract, from between the lines, many other meaningful findings about RIN price behavior.
Hoekstra D4T
In October 2020, Hoekstra Trading released the ATTRACTOR D4 RIN price spreadsheet. It directly applies the theory published in the IMS article.
Every week, ATTRACTOR calculates an updated theoretical RIN value we named “D4T”.
In Figure 2 below, I have appended a chart of Hoekstra’s D4T value and D4 RIN market prices to the right of the chart above, giving a 13.5 year record comparing D4 RIN market prices vs. theoretical values using the IMS model.
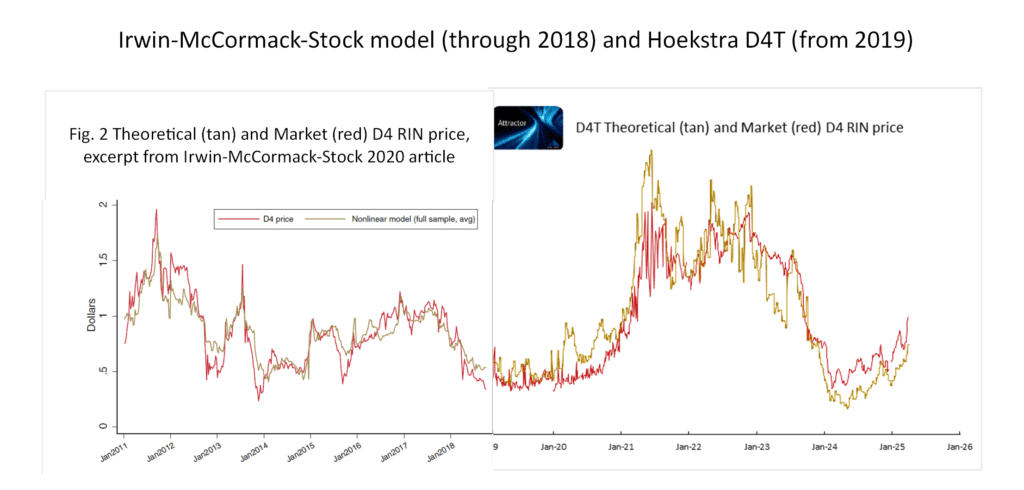
Hoekstra D4T, calculated by ATTRACTOR from 2019 onward, shows the same macro-features seen in the chart from the IMS 2020 article — the macro moves in the theoretical value track the macro moves in the D4 market price well, but with substantial gaps between the theoretical and market prices that last for periods of up to a year.
In neither the IMS article nor the ATTRACTOR model are the data series back-fit to re-tune the theoretical model to the market data over time. The D4T value is reported to and published by Bloomberg once each week in real time, and those reported values are fixed forever.
What can be learned from this?
In Part 1 of this series, we pointed to 3 reasons for the gaps between the D4 market price and D4T:
- The RIN Time Value Factor
- The Non-RIN Subsidy Factor
- The Regulatory Policy Factor
In the next part of this series, I will publish some more on our analysis of the gaps.
Original work
We are doing things not being done elsewhere to produce this valuable capability for our clients. If you are interested but not yet using it, please do 2 things:
- keep following this series of blog posts to learn more
- take the lead — ask yourself, and your boss, why not acquire this capability and use it in real time? The cost is negligible.
Recommendation Get Hoekstra Research Report 10 and the ATTRACTOR spreadsheet
Get the Attractor spreadsheet, it is included with Hoekstra Research Report 10 and is available to anyone at negligible cost.
George Hoekstra
+1 630 330-8159