Comparing Theoretical and Market Renewable Identification Number (RIN) Prices Part 3 – Anticipating Changes in Tax Subsidies
Read other blogs in this series – Comparing Theoretical and Market RIN Prices:
- Part 1 Three Factors
- Part 2 How Well Do RIN Market Prices Track With Economic Theory?
- Part 3 Anticipating Changes in Tax Subsidies
- Part 4 Over-reacting to Regulatory Policy Changes
- Part 5 RIN Price Forecasting
Figure 1 (whose title says Fig. 2) shows a copy of Figure 2 extracted from the published Irwin-McCormack-Stock (IMS) article that defines D4T and the ATTRACTOR model.
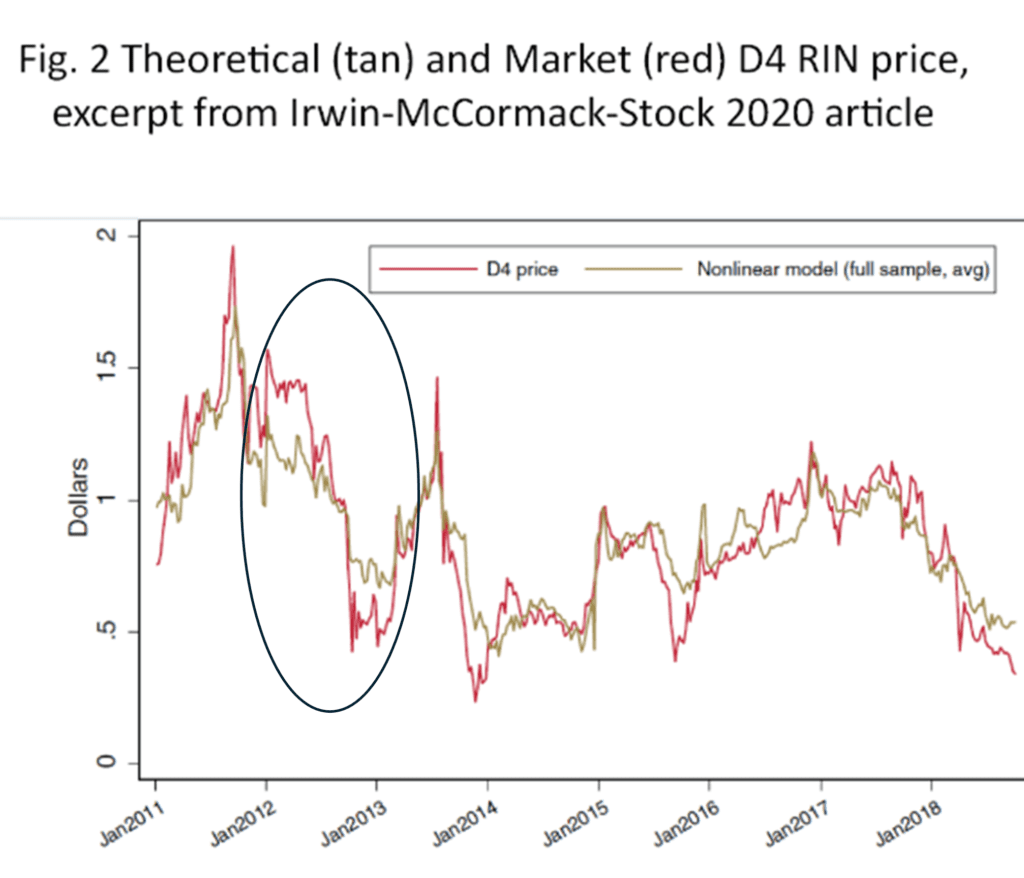
In Part 2 of this series, I said this chart:
Shows that the D4 RIN theoretical value (tan) tracks the D4 RIN market price (red) well, far better than any other RIN model or any credible RIN price forecasting method of which I am aware . . .
We now focus on the price action in 2012, highlighted by the black oval in Figure 1. The market price (red) started the year much higher than the theoretical price (tan), dropped rapidly in the middle of the year to below the theoretical price, and then recovered to equal the theoretical price at the end of the year. This formed 2 large gaps, positive in the first half of the year and negative in the second half of the year.
This gives an historical example of the second point of the above quotation from Part 2 of this series:
. . . nevertheless, there are frequent gaps between the theoretical and market prices. If you look carefully, the gaps between the tan and red curves are often substantial, and continue for periods of up to one year.
What caused these two substantial gaps in 2012?
Figure 2 below shows the same data from the ATTRACTOR spreadsheet:
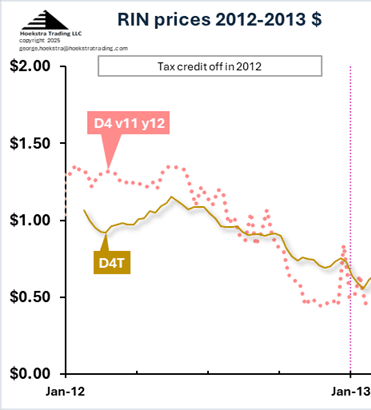
The answer is that, on Jan 1, 2012, the $1/gal blender’s tax credit (BTC) expired, causing a step drop in biodiesel margins of $1.00 per gallon (which corresponded to $0.67 per RIN because each gallon of biodiesel generated 1.5 D4 RINs). As the year 2012 progressed, the RIN market price declined in gradual anticipation of the BTC being renewed, which it was, at the beginning of 2013.
The IMS theoretical model (and the ATTRACTOR spreadsheet) simulate the BTC with a variable that is either 1 or 0 and that switches from one to the other in instantaneous step changes, representing the state of the blender’s tax credit. Given a value for that variable (1 means BTC is on, 0 means BTC is off), there is a probability it will change to the other state at the start of the next year. The D4T curve represents the theoretical value of the RIN given the anticipation of an 80% likelihood the BTC would be renewed at the end of the year, which it was.
The gap in the first half of 2012 shows that a trader using this model who anticipated the return of the blender’s tax credit had big opportunity to cash in on that expectation by effectively be short the D4 RIN before the market started factoring that possibility into the D4 RIN price. And using this model, that trader could immediately quantify the impact of that possibility with a simple estimate if its probability.
Part 4 of this series will continue this analysis of the 2012 D4 RIN price action.
Original work
We are doing things not being done elsewhere to produce this valuable capability for our clients. If you are interested but not yet using it, please do 2 things:
- keep following this series of blog posts to learn more
- take the lead — ask yourself, and your boss, why not acquire this capability and use it in real time? The cost is negligible.
Recommendation Get Hoekstra Research Report 10 and the ATTRACTOR spreadsheet
Get the Attractor spreadsheet, it is included with Hoekstra Research Report 10 and is available to anyone at negligible cost.
George Hoekstra
+1 630 330-8159