Modeling RINs As An Option – Part 2
Also see Part 1 of this series
In Figure 1, the silver points represent the price of D4 RINs that expire at the end of that trading year (2012), and the gold points represent RINs that expire at the end of the next trading year (2013).
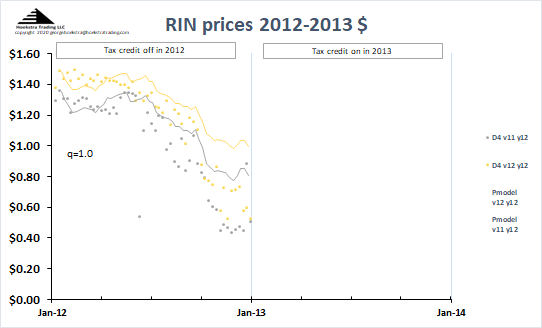
The lines are calculated by the Hoekstra Trading RIN pricing spreadsheet which uses the IMS (Irwin-McCormack-Stock) RIN pricing model. As Figure 1 indicates, the $1/gallon blender’s tax credit was not in effect in 2012 but was in effect in 2013.
The model lines are near the data in the first quarter of 2012, but above the data the rest of the year. The deviation in 2012 actual versus theoretical prices was noticed and interpreted in real time by Scott Irwin. His interpretation was:
“Traders in the secondary RINs market obviously anticipated the retroactive reinstatement of the blenders’ credit and calibrated D4 prices with that scenario in mind.”
from Irwin, S. “The Remarkable Foresight of Biodiesel RINs Traders.” farmdoc daily (3):187, Department of Agricultural and Consumer Economics, University of Illinois at Urbana-Champaign, October 2, 2013.
As 2012 progressed, market participants started taking actions in anticipation of the expected reinstatement of the blender’s tax credit in 2013, and those actions had the effect of lowering the D4 RIN price.
Scott Irwin’s observation eventually led to development of the IMS RIN pricing model which uses a Markov process to describe the blender’s tax credit with parameters p and q being probabilities the credit’s status will change. Part 1 of this series gives more details on modeling the 2012 price behavior and shows how changing the parameter q allows the model user to quantify the anticipation of a change in credit status like occured in the 2012-2013 time period.
Figure 2 below includes the data and model-calculated prices for trading year 2013:
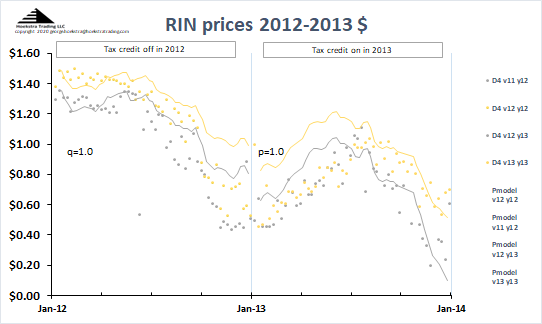
In 2013, the trend was opposite to 2012, that is, the actual D4 prices were below the model the first half of the year, and near the model the second half of the year. The chart indicates the value of q is 1.0 for trading year 2012, that means the model is calculating RIN prices for 2012 assuming the blender’s tax credit is off and will stay off through 2013; whereas for trading year 2013, the value of p is 1.0 meaning the model is calculating RIN prices assuming the blender’s tax credit is on and expected to stay on. If you change the values of q and p in our spreadsheet, you can see the model lines shift as a function of these probabilities, indicating shifts in the market’s estimate of the probability the credit status will change in the future.
It is especially interesting that the difference between data and model remains large in the first half of 2013, a year when there was no longer uncertainty about the credit’s status. It appears the market adjusted to that new credit reality gradually, that is, there was a delayed reaction to what was no longer uncertain. Does that mean there were arbitrage opportunities then?
In Part 3 of this series, we will fast forward to 2023, a year when we are again seeing large deviations between theoretical and actual D4 RIN prices.
Recommendation
Anyone with a stake in RINs pricing and economics should get Hoekstra Research Report 10 which includes the Hoekstra ATTRACTOR spreadsheet spreadsheet that accurately calculates D4T, the theoretical RIN price, tracks it versus quoted market prices, and predicts how RIN prices will change with the variables that affect them. Why not send a purchase order today?
George Hoekstra george.hoekstra@hoekstratrading.com +1 630 330-8159
Anyone with a stake in RINs pricing and economics should get Hoekstra Research Report 10