Attractor – A RIN Price Model That Accurately Calculates RIN Prices
Hoekstra Trading’s Attractor RIN price model is a spreadsheet that calculates the theoretical value of the D4 Renewable Identification Number (RIN) and enables the user to study theoretical vs. market RIN prices. The theoretical value is calculated using Hoekstra Trading’s spreadsheet application of the Irwin-McCormack-Stock (IMS) equation which is based on fundamental economic theory
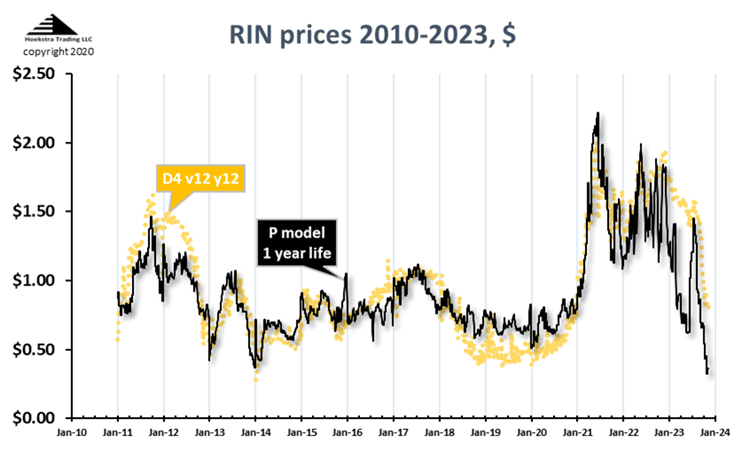
The black line in Figure 1 is the theoretical value and the gold points are the D4 RIN market price. The model does a good job explaining major market price movements over the entire 13-year history of the RIN.
Don’t speculate
For example, when we saw the RIN price shoot up in 2021, and the high volatility since then, we knew in real time what was causing those movements because we were calculating them from fundamental economic theory (that is the black line). When you see the market price following the path that economic theory says it should be following, there’s no reason to speculate on other possible causes. The laws of economics, quantified, are more reliable than qualitative, ungrounded speculation.
The black line shown above is not back fit or tuned, it is simply calculated, once a week, from weekly updates of available market data, using a single set of 4 model parameters that are held constant through the entire 13-year period on this chart.
Winning strategies
For anyone whose profit is affected by RIN prices, it is useful to know each week why, in theory, the RIN price should have moved up or down, and compare that with what actually happened. As shown in the chart, in most cases, this model explains the important price movements.
But the biggest value comes when the market price separates from the black line. What could potentially cause that separation? Does that potential cause have the quantitative power to explain that move? What else might have caused it? . . . and so on.
Skilled use of this spreadsheet allows the user to quantify the effects of potential causes to help judge their explanatory power. Three years of success have proven that quantitative fundamental analysis using this model gives solid grounds for winning RIN strategies. Some examples will be shown in future posts.
Reliable attractor
Over the last 3 years, when we’ve done quantitative analysis of historical cases where there was separation of actual price from theoretical price, as described above, we’ve concluded this model is a reliable attractor — that means price will tend to gravitate toward it — and it is wise to understand this model and use this spreadsheet to track and analyze theoretical and market prices, anticipating a bias that will attract the RIN market price toward the black line.
Why not?
It makes sense for anyone involved with RINs to do this kind of analysis using economic fundamentals as your guide. Without a model like Attractor, you can only guess why the price is where it is and why it’s bouncing around like it does. Why not have this user-friendly spreadsheet to ground your analysis in fundamentals and help guide your strategy?
That is my business. I am a researcher. I have no other business than developing and selling useful fundamental information that is not otherwise available, packaged in user-friendly form for those who can use it, and am looking for people who want exactly that – something to help understand what drives the RIN price at a fundamental economic level and use that understanding to help ground a well-informed strategy. If that is you, please contact me so you can get this model and everything behind it. It is available to anyone, it is easy to use, and it is cheap.
Conclusions
- The Hoekstra Trading Attractor spreadsheet model does a good job matching the important moves in D4 RIN price history
- Over 3 years, Attractor has proven its value for quantitative analysis of actual and theoretical value
- Such analysis leads to well-informed RIN strategies
Recommendation
Those with a stake in RINs pricing and economics should get Hoekstra Research Report 10 which includes the Attractor spreadsheet that calculates theoretical D4 RIN values using the Irwin-McCormack-Stock (IMS) RIN price model (black line on chart below) based on economic fundamentals, tracks them versus actual prices (silver and gold data points), predicts how the D4 RIN price will change with the variables that affect it, includes 6 months of unlimited consultation by phone and E-mail, and is available to anyone immediately at negligible cost.
It is not a monthly newsletter, it is a research report based on millions of dollars worth of academic work on RIN fundamentals that will give you a new perspective on RIN pricing and economics, unique insights and practical tools your company can use to better track, interpret and anticipate RIN price movements. Here’s the offer letter including the Table of Contents and a sample invoice with all the information needed to prepare a purchase order. Why not send a purchase order today?

Turkey day update
The Hoekstra IMS RINs pricing spreadsheet shows the D4 RIN market price (gold and silver points) and the theoretical D4 RIN value updated through Friday November 17, 2023. The theoretical value of a hypothetical D4 RIN with 1 year remaining life is $0.80.
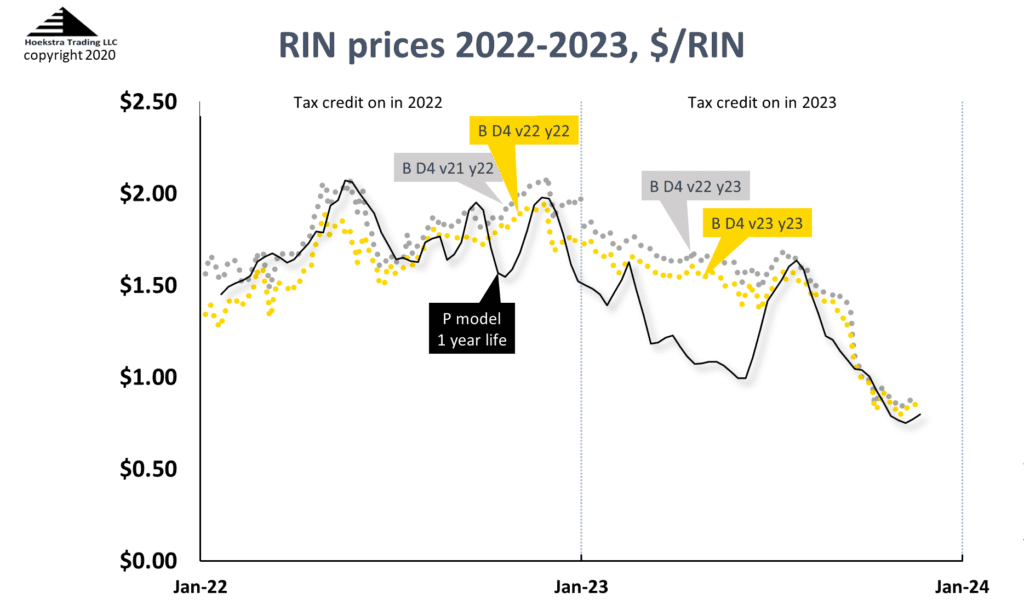
Hoekstra Trading clients use this spreadsheet to compare theoretical and market prices, analyze departures from theoretical value, and identify trading opportunities on the premise RIN market prices will be attracted toward their fundamental economic values.
George Hoekstra george.hoekstra@hoekstratrading.com +1 630 330-8159