What’s Next for Cellulosic Biofuels and the D3 RIN Part 6, Quantitative Theoretical Modeling of RIN prices.
Read previous blogs in this series:
- Part 1 – The Market That Fizzled
- Part 2 – The Biogas Solution
- Part 3 – Rewind to the Fast Crash of Kior, a Cellulosic Biofuel Company
- Part 4 – Fueling Heavy Duty Trucks With Fuel From Cows
- Part 5 – Impact of EPA’s Partial Waiver on the D3 RIN Price
- Part 6 – Quantitative Theoretical Modeling of RIN Prices
- Part 7 – D3 RIN Price – Is The Market Off By a Factor of Ten?
- Part 8 – A New Industry Emerges
- Part 9 – Tracking the D3 RIN price
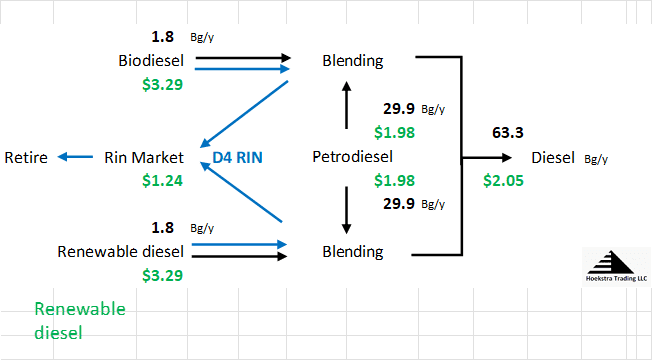
Hoekstra Trading’s ATTRACTOR spreadsheet was released in 2020. It uses this diagram of the diesel branch of the Renewable Identification Number (RIN) price control system. NOTE: THE NUMBERS SHOWN IN FIGURE 1 ARE HYPOTHETICAL.

If you were a chemical engineer looking at Figure 1, you would instinctively start drawing circles around the “units” and writing down “material balance” equations for the entities flowing in and out of the units, which in this case are fuel streams (black), RIN credits (blue) and dollars (green). Economists would call those same equations “market clearing conditions”.
If you were an economist looking at Figure 1, you would instinctively start drawing supply and demand curves on charts showing prices versus flow rates (or “quantities”) of the entities, and find where they intersect. Chemical engineers would call those same supply and demand curves “property relationships”.
Material balances are equations that state the conservation of entities that are conserved in a process. In a competitive fuel market under the control of the RIN, they include the gallons of fuels, dollars, and gallons of ethanol-equivalent RINs.
Property relationships are typically shown in charts that define properties of those entities. In this system, they include, for example, the quantities supplied and demanded, the heating values of the fuels, and elasticities of supply and demand for the flowing streams.
A fundamental economic model
Combining the know how of the engineer and economist in this way enables derivation of the fundamental economic model of the RIN price control system implemented in the ATTRACTOR spreadsheet that was released in 2020. ATTRACTOR was developed using principles of RIN price theory published in this article by Scott Irwin, Kristin McCormack and James H. Stock and this dissertation by Ben Meiselman, and their references.
To do this, we write down a set of equations, in terms of an equal number of unknowns, and solve it for the unique set of values for the flow rates and prices of the physical streams, dollars, and RINs flowing through the process, for a given set of input values.
After the system of equations is solved, we vary the values of the variables and input parameters and observe otherwise surprising responses, like the 2023 D4 RIN price crash, and many other non-intuitive price responses. These surprising responses can be foreseen and anticipated, not through crystal-ball gazing, but through recognition of how they fall out of the system of equations as non-intuitive, logical outcomes of the design of the RIN price control system.
These surprising responses can be foreseen and anticipated, not through crystal-ball gazing, but through recognition of how they fall out of the system of equations as non-intuitive, logical outcomes of the design of the RIN price control system.
Paper simulations with this model allow you to foresee, understand, and anticipate those price behaviors, instead of trying to navigate the system without a roadmap like ATTRACTOR to help anticipate the cliffs, boundaries and trapdoors that will otherwise blindside you.
One of those non-intuitive price behaviors is occurring in the market right now, providing arbitrage opportunities for those with the awareness and will to capture it.
It is better and more profitable to foresee, understand, and anticipate these non-intuitive price behaviors in paper simulations before they occur, instead of in real life after they have rocked the markets.
D4T – the first licensed theoretical value of an environmental credit
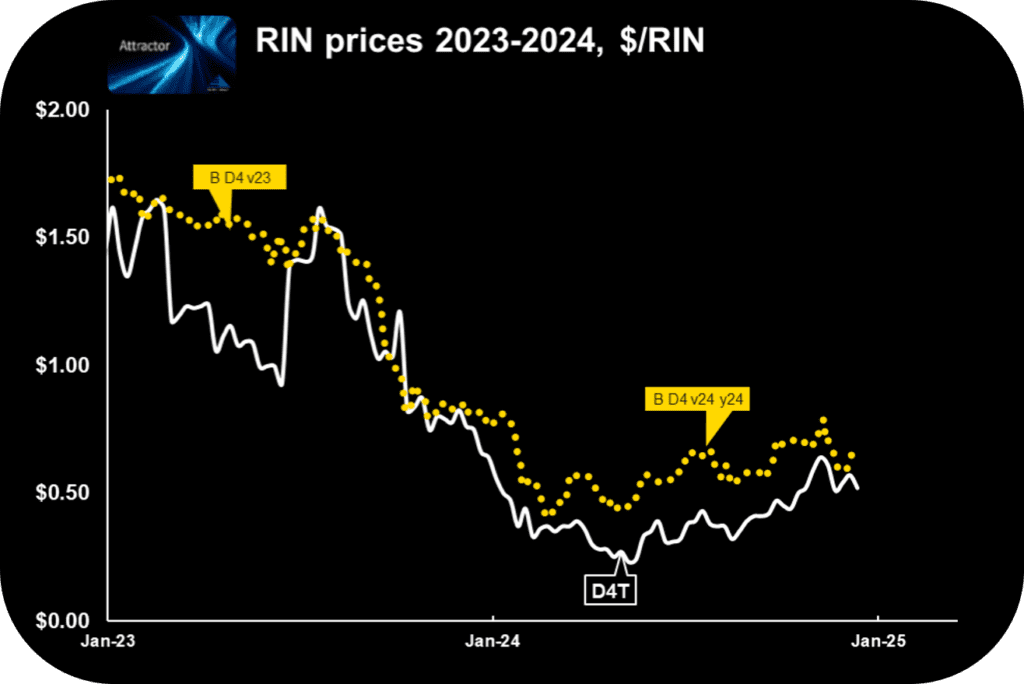
One output from ATTRACTOR is D4T, the world’s first licensed theoretical value of an environmental credit. D4T was made available to Hoekstra Trading clients in October 2020, then licensed by Hoekstra Trading to Bloomberg Finance LP in December 2023, which made it available with weekly updates to Bloomberg users and subscribers through the Bloomberg terminal.
See Figure 2 for the last 2 years’ comparison of the market and ATTRACTOR theoretical values of D4T.

D3T – the theoretical value of the cellulosic (D3) RIN
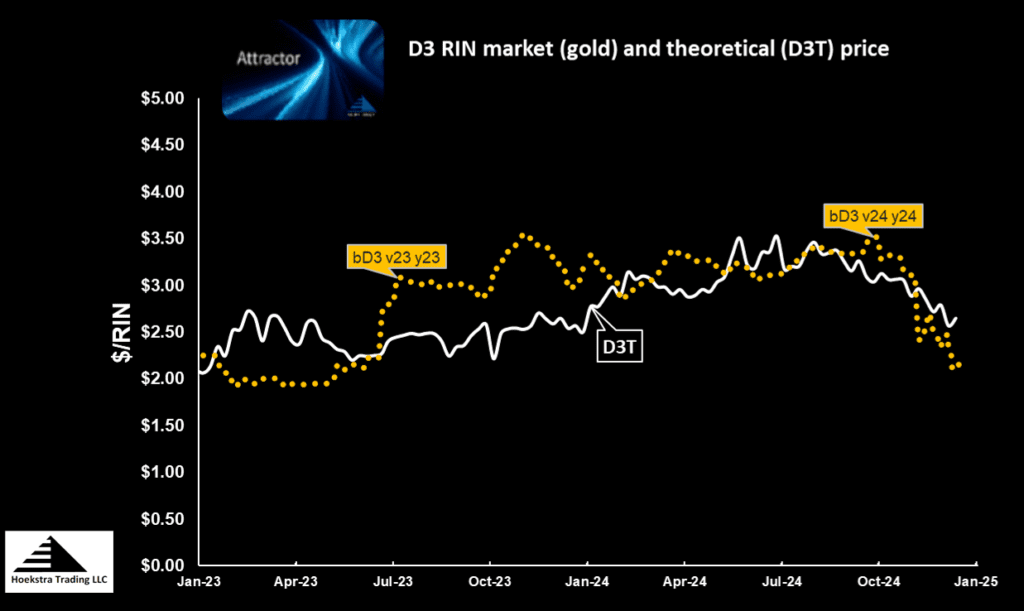
D3T is the world’s second licensed theoretical value of an environmental credit. It is calculated weekly and is now available to Hoekstra Trading clients and Bloomberg Finance LP users and subscribers to the Bloomberg terminal. Figure 2 shows the last 2 years’ history of the market price and ATTRACTOR-calculated values of the D3 RIN.

Unlike other empirical RIN pricing models, there is no back-fitting or re calibration of the D4T and D3T theoretical models in ATTRACTOR. When this week’s value is reported to Bloomberg, it is set in stone forever.
Quantifying the impact of the cellulosic biofuel partial waiver
Last week, when EPA released their proposal to reduce the minimum volume requirements for cellulosic biofuel, we quickly made a quantitative estimate of the theoretical impact of that change on the D3 RIN price.
How was that done? It is a typical sensitivity study in which you ask: if you change a parameter value, how much does that change RIN prices? One equation in ATTRACTOR’s system of equations states a relationship between the flow rate of D3 RINs and the flow rates of cellulosic biofuels delivered to the U.S. market. Another equation states that the minimum quantity of D3 RINs to be retired in 2024 is a constant times the flow rates of petroleum gasoline and diesel delivered to the U.S. market. To estimate the impact of the partial waiver on the D3 (and other) RIN prices, we simply reduced that constant from 0.63 to 0.51 as proposed in the partial waiver, pressed the RUN button, ATTRACTOR ran the numbers and calculated the D3 RIN change to be $0.11 per D3 RIN.
Conclusions:
- The complexities of the RIN system can be understood with the help of a fundamental model of the RIN price control system that uses diagrams like Figure 1.
- Without such a model, participants in the RIN markets continue to be confused by those RIN complexities.
- With ATTRACTOR, non-intuitive behaviors of RIN prices can be foreseen and anticipated, not through crystal ball gazing, but through awareness of price outcomes that fall out of the fundamental model equations.
- The ATTRACTOR spreadsheet gives a big competitive advantage to those who use it.
Recommendation Get Hoekstra Research Report 10

Hoekstra Trading clients use the ATTRACTOR spreadsheet to compare theoretical and market Renewable Identification Number (RIN) prices, analyze departures from theoretical value, and identify trading opportunities on the premise RIN market prices will be attracted toward their fundamental economic values.
Get the Attractor spreadsheet, it is included with Hoekstra Research Report 10 and is available to anyone at negligible cost.
