All Eyes on Renewable Diesel Margins – Part 3, RIN Price Crash Wipes Out Free Market Gains
Read other posts in this series: All Eyes on Renewable Diesel Margins:
- Part 1, Get Ready For Q1 Earnings Reports
- Part 2, The High Cost of Renewable Diesel
- Part 3, RIN Price Crash Wipes Out Free Market Gains
- Part 4, What Caused the $1.70 Crash in RIN Value?
- Part 5, Hard Numbers on Renewable Diesel Margins
The starting point for our analysis of renewable diesel (RD) margins is the cost to produce RD in a plant feeding soybean oil. In Part 2 of this series, we showed that cost was $5.30 per gallon in April, 2021 which was almost triple the $1.90 wholesale market price of the RD at the time.
Figure 1 shows those variables along with their values in April, 2024:
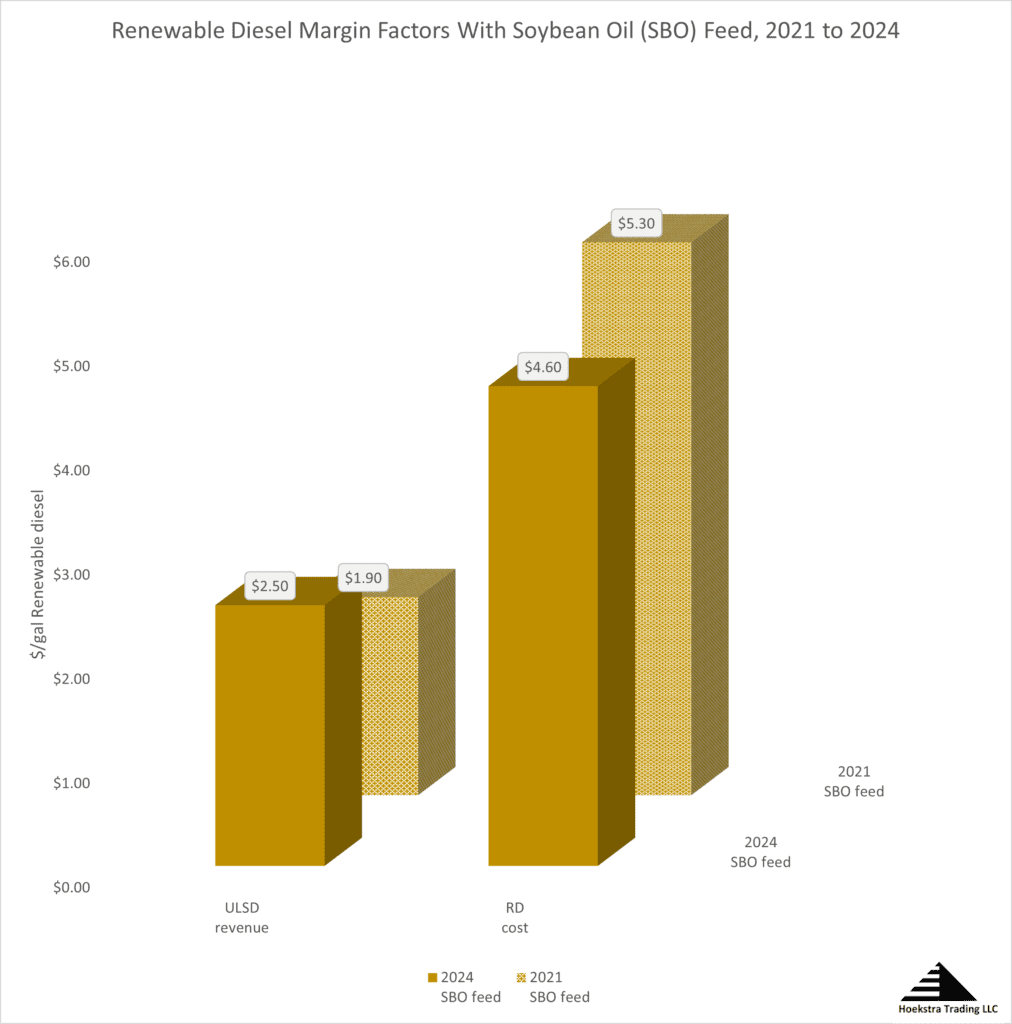
Between 2021 and 2024, the revenue from selling a gallon of RD went up from $1.90 to $2.50, which is a 60 cent revenue increase, and the cost of producing that gallon went down from $5.30 to $4.60, which is a 70 cent savings. That means the “market margin” on renewable diesel improved by $1.30/gallon which is great news for the RD producer.
But, as we said last week, the bad news is the “market margin” on renewable diesel was negative $3.40 in 2021. So an improvement of $1.30 still leaves the RD producer $2.10 in the hole, before adding in the subsidies. This situation is highlighted in Figure 2 by the two red bars indicating a “market margin” of negative $3.40 in 2021 and, in the right panel, a negative $2.10 in 2024:
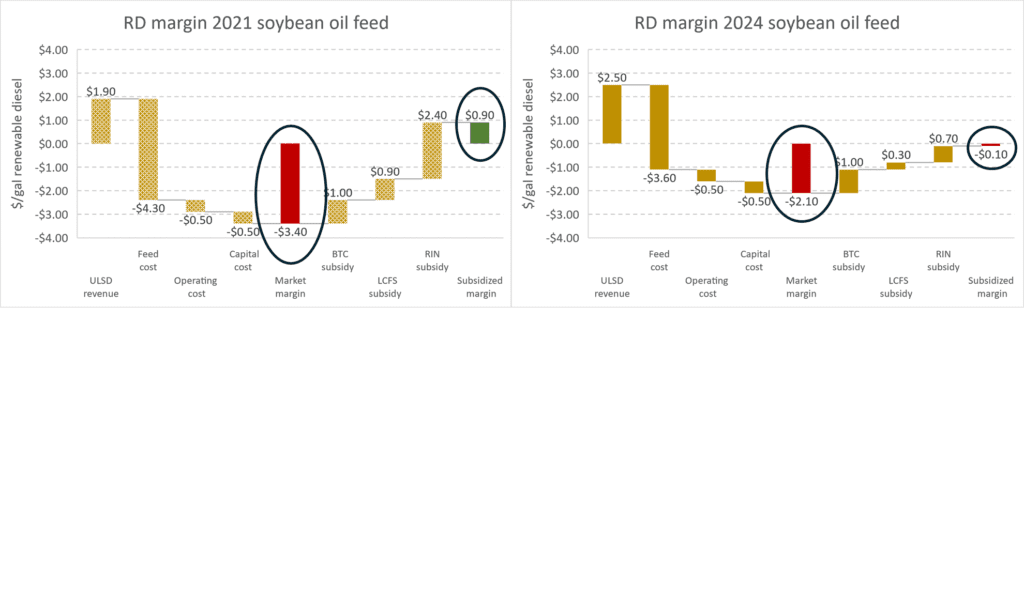
The bars to the left of the red bars break down the components of the market margins.
The second half of the margin analysis is the subsidies which are broken down to the right of the red bars. They are the blender’s tax credit (BTC) which was unchanged at $1.00 in both 2021 and 2024, the California Low Carbon Fuel Standard (LCFS) subsidy, which fell 60 cents from 90 cents to 30 cents, and the Renewable identification Number (RIN) subsidy, which fell $1.70 from $2.40 to 70 cents, wiping out all the free market gains and more. Combined, the subsidies fell by $2.30, and the subsidized margin fell from a 90 cent profit in 2021 to a 10 cent loss in 2024 despite a large improvement in free market margin.
Noteworthy points from working the numbers on this representative case are:
- The $1.70 drop in RIN value alone wiped out a $1.30 improvement in free market margin
- The combined $2.30 drop in subsidy value put what had been a highly profitable plant underwater on margin.
- The analysis points to the salient question: Why did the RIN value fall by $1.70/gallon?
Conclusions:
- RD subsidies, and especially the RIN subsidy, are the foundation of RD profitability.
- Subsidy values have been more volatile than the volatile commodities they depend upon.
- Big gains in economic value can be wiped out by big losses in the value of subsidies.
I appreciate those who are reading my writings on this topic! This is a reminder that what is written here is mostly years-old news to Hoekstra Trading clients. Our best, most valuable, and current work is available by becoming our client through purchase of our annual reports like Hoekstra Research Report 10, which are available to anyone a negligible cost and which, if you are seriously interested in this topic, you really should have!
ATTRACTOR UPDATE
The Attractor spreadsheet shows the D4 RIN market price (gold points) and the “D4T” theoretical value (white line) updated through last Friday. The theoretical value of a hypothetical D4 RIN with 1 year remaining life (D4T) is $0.27.
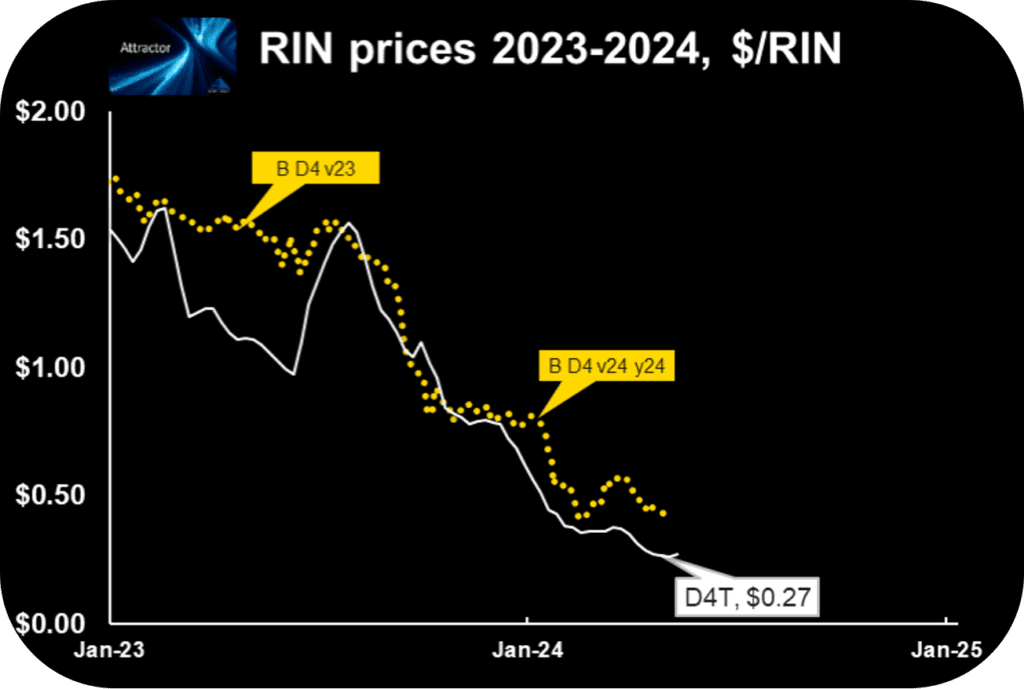
Hoekstra Trading clients use this spreadsheet to compare theoretical and market prices, analyze departures from theoretical value, and identify trading opportunities on the premise RIN market prices will be attracted toward their fundamental economic values.
Get the Attractor spreadsheet, it is included with Hoekstra Research Report 10 and is available to anyone!

George Hoekstra george.hoekstra@hoekstratrading.com +1 630 330-8159