Baby the RIN Must Fall Part 2 – Will A RIN Price Crash Make a Mess In The Renewable Diesel Market?
U.S. production of hydrogenated renewable diesel (RD), made from soybean oil and animal fats like used cooking oil, is growing faster than expected. That may sound like good news for the renewable fuels industry, but it comes with the fear that the rapid growth might trigger a sudden crash of Renewable Identification Number (RIN) prices that would rock the market. In today’s blog post, we have a go at describing what that might look like.
An edited version of this post was published on the RBN Energy Daily Blog Jul 27, 2023. Read other blogs in this series Baby The RIN Must Fall –
- Part 1 What’s Behind The Chatter About The RIN Price Crashing To Zero?
- Part 2 Will a RIN Price Crash Make a Mess In The Renewable Diesel Market?
- Part 3 The Odds and Timing Of A Potential RIN Price Crash
- Part 4 D4 RIN Nosedives, Triggering a Flurry of Market Reactions
As we discussed in Part 1 of this series, hydrogenated RD is a type of biomass-based diesel being made today in refinery units previously used to make petroleum diesel and gasoline. It has quickly overtaken the other type of biomass-based diesel — FAME biodiesel — in market share.
In fact, the rapid growth of hydrogenated renewable diesel supply may soon bring the U.S. total biomass-based diesel supply beyond the mandated levels set by the Environmental Protection Agency (EPA). At that stage, the EPA can declare mission accomplished and move on to something else, right? Wrong. Because if those targets are surpassed, the RIN credit, which functions as the primary subsidy supporting the growth, would theoretically disappear.
If those targets are surpassed, the RIN credit, which functions as the primary subsidy supporting the growth, would theoretically disappear.
That’s like taking the training wheels off a bike — are we ready for that?
The RIN – a tax and a subsidy
To make sense of what might happen to the biodiesel market when the wheels come off, the essential first step is to understand how the RIN functions in the fuels market. The RIN credit system is complex, as we covered in Part 1 of this series. Fortunately, for today’s purposes, we can bypass all the regulatory lingo, detailed charts and tables, because we only need to know one fundamental feature of the RIN: it is not merely a tax, like a sales tax, or a subsidy, like a tax credit. It is both a tax and a subsidy.
When a refiner buys a RIN, which is like paying a tax on the petroleum fuel they produce, that payment ends up subsidizing production of the applicable biofuel that would otherwise be uneconomical.
This is called a cross-subsidy. In the case of the RIN, the tax gets transformed into a subsidy without supervision or other human intervention, through the design of the system and the workings of competitive markets.
Furthermore, the price of the RIN adjusts automatically to the level of subsidy needed to draw out the next-lowest-cost gallon of biofuel supply. That RIN price level is directly related to the difference between the cost of the incremental biofuel gallon and the price of the petroleum fuel it replaces. Once Renewable Fuel Standard (RFS) mandates are set, this all runs on autopilot.
With that understanding of the cross-subsidy feature, we can see the implication of a RIN price crash — the corresponding RIN tax and RIN subsidy simultaneously disappear.
With that understanding of the cross-subsidy feature, we can see the implication of a RIN price crash — the corresponding RIN tax and RIN subsidy simultaneously disappear.
The vanishing RIN
The rapid growth of hydrogenated renewable diesel production is approaching a critical threshold at which one or more RFS volume mandates could be surpassed. Should that happen, it would trip a switch that would slam the price of the D4 (biomass-based diesel) RIN down to the floor. That’s because the demand for a RIN depends on there being a shortage of biofuel supply compared to the applicable mandate, and that shortage is what compels refiners to bid for that RIN. When the aggregate supply rate is enough to produce all the necessary biofuel prescribed by the mandate, there is by definition no shortage, there is no economic demand for the RIN and so the price would collapse.
When the aggregate supply rate is enough to produce all the necessary biofuel prescribed by the mandate, there is by definition no shortage, there is no economic demand for the RIN and so the price would collapse.
In a free, competitive market, increased supply of a product drives its price down to a level that attracts enough new buyers to soak up the increased supply. As conditions change, the market price fluctuates until the quantity supplied equals the quantity demanded. But a collapse of RIN prices would not be like normal continuous fluctuations around a supply/demand equilibrium point; it would be an abrupt, radical change from a RIN-subsidized market to a free, competitive market — accompanied by a step down in the equilibrium RIN price.
This situation is pictured in Figure 1 below, in a supply/demand chart, using recent price and supply data.
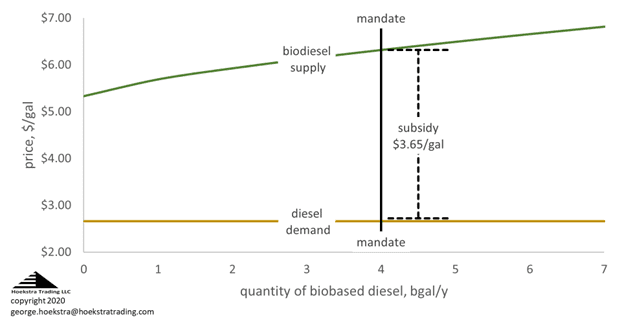
The biodiesel supply curve (green line) is upward sloping, with costs in the range of $5-$7/gal. The diesel demand curve (gold line) is horizontal at a price of $2.70/gal, indicating that, over this range of supply, incremental biodiesel substitution does not change the demand for diesel fuel. There is no supply/demand intersection point, indicating there is no free-market equilibrium at which biodiesel is an economical substitute for petroleum diesel.
there is no free-market equilibrium at which biodiesel is an economical substitute for petroleum diesel.
The subsidy required to force the profitable supply of biodiesel is indicated by the price gap between supply and demand; in this example, that gap is $3.65/gal (dotted line) at the mandated quantity of 4 billion gal/year (solid black line). That gap must be bridged by the value of the RIN plus other subsidies like the federal bio-based diesel tax credit.
The subsidy required to force the profitable supply of biodiesel is indicated by the price gap between supply and demand; in this example, that gap is $3.65/gal
In today’s subsidized biomass-based diesel market, the price a supplier receives includes a baked-in RIN subsidy equal to 1.5 to 1.7 times the price of the D4 RIN. (Biomass-based diesel generates 1.5 RINs/gal, while RD earns 1.7 RINs/gal.) The D4 RIN price has ranged from $1.50-$2.00/gal over the past two years, meaning the RIN subsidy is covering between $2.25/gal (1.5 x $1.50) and $3.40/gal (1.7 x $2) of that gap.
The RIN subsidy is covering between $2.25 and $3.40 of that gap.
Other subsidies cover the remaining part of the gap and provide the profit margin for suppliers. Consider what would happen if the RIN price collapsed. A drop of $2.25-$3.40/gal would jolt the market and put a whole block of suppliers underwater on profitability.
A drop of $2.25-$3.40/gal would jolt the market and put a whole block of suppliers underwater on profitability.
Some suppliers would withdraw unprofitable supplies from the market rather than accept negative margins. But if a whole block of supply was withdrawn from the market, that could reduce the aggregate supply back below the mandate, which means the mandate would kick back in and the RIN price would snap back up, again making it profitable for those marginal suppliers to resume production.
It is hard to say what would happen in the real world around this boundary, where a mandate and a subsidy rule on one side and the unsubsidized free market rules on the other.
It is hard to say what would happen in the real world around this boundary
That question is now of immediate interest to anyone with a stake in the RIN market. For answers about what might happen next, we look first to historical precedents.
The Big Bang precedent
This is not the first time the renewable fuels market has crossed an RFS threshold. The D6 (conventional ethanol) RIN rocketed 100-fold — that’s 100-fold, not 100% — in a few months during 2013 in a period known as “RINsanity” because the use of ethanol in gasoline hit the 10% maximum allowed in gasoline, a threshold known as the blend wall. The RIN rules implicitly required that, beyond that threshold, refiners would need to buy more D4 RINs to meet their D6 RIN obligations. That caused the D6 RIN price to snap right up to the D4 price in what stands out, on the charts, as a huge stair-step price change, which triggered turmoil in the fuel markets, including financial impacts in the tens of billions of dollars per year and a 10-year legal battle that went all the way to the U.S. Supreme Court and which, to our knowledge, is still not resolved. (See our Big Bang Theory blog series for the full story on that mess.)
From the Big Bang precedent, we can conclude it is not at all unreasonable to expect another real mess when we cross the biomass-based diesel mandate threshold.
From the Big Bang precedent, we can conclude it is not at all unreasonable to expect another real mess
To emphasize the parallels, we will call the bio-based diesel mandate threshold the “End Wall.” Hitting the end wall would be the opposite of hitting the blend wall, in the sense that the blend wall tripped a switch that shifted a market from free-market control to a subsidized market, where it has remained ever since — and that was accompanied by a spectacular one-way step increase in the price of the applicable RIN. Now, 10 years later, hitting the end wall would trip a switch that shifts a market back to free-market control and would be accompanied, in theory, by a spectacular step decrease in the price of the applicable RINs.
hitting the end wall would trip a switch that shifts a market back to free-market control
There are other historical precedents where RIN thresholds were crossed. They caused less spectacular price reactions and did not make headlines, but the reactions were generally consistent with RIN pricing theory and have proven to be highly instructive case studies. We will examine one of those cases in the next blog in this series.
Theory and real life
A useful step in anticipating the consequences of the end wall is to consider which theoretical assumptions are likely to apply in real life. For example, the theory assumes that market players precisely know their costs of production and net profit margins, broken down by individual feed/product combinations, and that they always act for the exclusive purpose of maximizing profitability. These may be good assumptions for an entrepreneurial biofuel producer with 50 employees, but perhaps not for $50 billion/year corporations. A small entrepreneurial company might shut down its biofuel reactor the morning after its margin goes negative, but we would not expect a big refining company to do the same with its newly converted biofuel refinery.
A small entrepreneurial company might shut down its biofuel reactor the morning after its margin goes negative, but we would not expect a big refining company to do the same
Similarly, the theory assumes that in the current run-up to the end wall no gallon of bio-based diesel has been supplied at negative margin. That assumption is also not applicable.
This leads directly to other questions about bio-based diesel profitability — how might the producers respond to the loss of RIN revenue? We can make conjectures on two possible real-world outcomes:
- If enough refiners are profitable, or get enough revenue to cover their marginal costs, or choose to continue operating in a zero-RIN world despite negative profitability, that could lead to the “mission accomplished” outcome, where the survivors sustain the aggregate supply beyond the mandated levels without the RIN subsidy.
- If enough suppliers reduce production, those who remain would compete in a RIN-subsidized market at the mandated volume, since the RIN value will increase to the level that subsidizes the last incremental gallon needed to meet the mandate.
Another important point is that the supply/demand equilibrium says nothing about the paths or times taken to move from one equilibrium state to another. For example, if a binding RFS volume mandate is increased, that shifts the effective demand higher, and supply/demand equilibrium theory says the new price is indicated by its intersection with the applicable supply curve. But the textbook supply/demand chart says nothing about what happens during the transition from the old to the new equilibrium point. As we have noted in earlier blogs, the Big Bang transition resulted in a 100-fold increase for the D6 RIN, just as standard supply/demand equilibrium theory predicted. In other RIN threshold transitions, the adjustments took longer. Nothing says this next transition couldn’t take years to shake out.
Nothing says this next transition couldn’t take years to shake out.
The consequences of breaching the end wall also depend on the status of the RIN carryover bank, the compliance deficit account, outstanding small refiner exemption liabilities, and the changing status of the other federal and state credits and mandates, all information that is available and can be factored into an analysis leading to an informed RIN price forecast and RIN credit strategy.
RIN economics seem complex, but they are in fact nowhere near as complex as a typical refinery process unit or a refinery itself. As in running a refinery, it is risky to rely on intuition and fast reaction time as the means for making decisions. One of those risks is being blindsided by a sudden crisis (in this case financial, not an environmental or safety crisis). This can be avoided with some forward planning based on fundamental understanding and good data.
One of the risks is being blindsided by a sudden crisis. This can be avoided with some forward planning based on fundamental understanding and good data.
With those in hand, it is not difficult for someone to use their own insights and judgments to make a well-informed assessment of the likely timing of the end wall and the possible consequences. Such forward planning is a good practice for those whose financial performance depends on RIN prices. In future episodes of this series, we’ll analyze the market response to another previous RIN threshold transition and address the question of when the end wall will be hit.
Recommendation
Anyone with a stake in RINs pricing and economics should get Hoekstra Research Report 10 which includes the Hoekstra IMS RINs pricing spreadsheet that accurately calculates theoretical RIN prices, tracks actual prices, and predicts how RIN prices will change with the variables that affect them. Why not send a purchase order today?