D4 Renewable Identification Number (RIN) Theoretical Price Drops To 66 cents
The Attractor RIN price model is a spreadsheet that calculates the theoretical value of the D4 Renewable Identification Number (RIN) using Hoekstra Trading’s spreadsheet application of the Irwin-McCormack-Stock (IMS) pricing model and our best estimates of the values of the fundamental economic variables that determine the D4 RIN value.
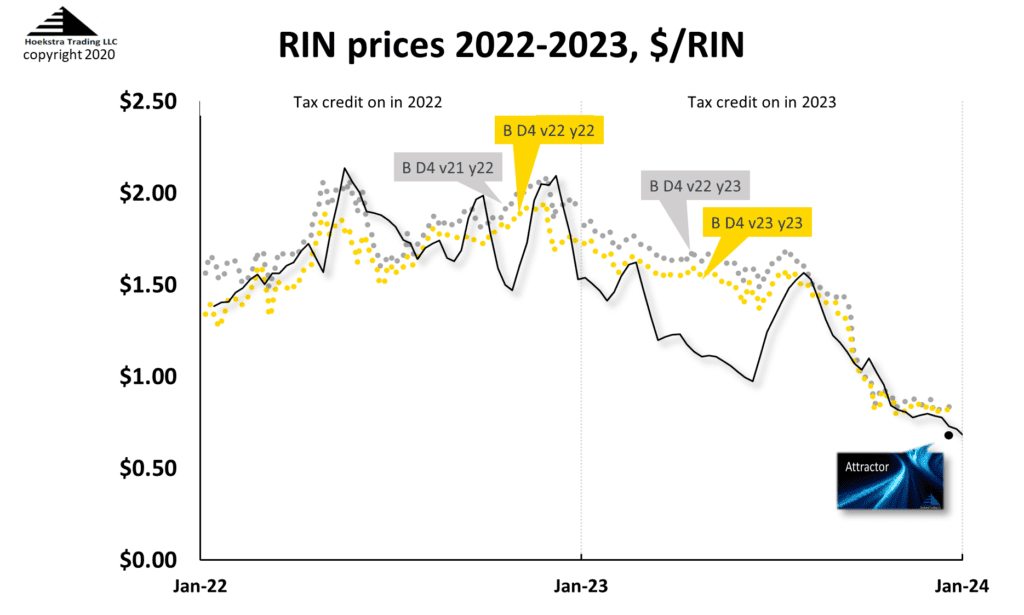
Figure 1. Attractor D4 RIN Price Chart
The calculated theoretical value of a D4 RIN expiring in 1 year is shown by the black line and the black data point at $0.66 which is the most recent value and is down 9 cents from last week’s theoretical value and 16 cents below the latest quoted market price of $0.82. Market prices in each year (y) are shown on the chart by gold data points for D4 RINs of that year’s vintage (v), and silver data points for the previous year’s vintage.
The 2023 price action shows a 3rd quarter nosedive in the market price which was foreshadowed by the 1st half nosedive in the black theoretical price. The 2023 price nosedive was the topic of several previous episodes of this weekly blog including Baby the RIN Must Fall Part 2, posted here July 7, 2023, and Baby the RIN Must Fall Part 4, posted Oct 6, 2023, and several more recent episodes.
The 2023 price action shows a 3rd quarter nosedive in the market price which was foreshadowed by the 1st half nosedive in the black theoretical price.
Falling supply curve
Our explanation of the nosedive is that rapid growth of hydrogenated renewable diesel production, in competition with fatty acid methyl ester (FAME) biodiesel, caused downward movement in the bio-based diesel supply curve, reflecting a falling industry cost of bio-based diesel; and that caused the RIN price to fall by the amount it did.
This explanation is different from the “RIN Cliff” scenario that has been widely discussed in trading and media circles and in our 2023 published articles and blog posts.
RIN cliff
To help see the difference between a falling supply curve and a cliff, Figure 2 (from an older blog post) shows a supply-demand chart for biobased diesel, with an upward sloping supply curve representing the incremental cost of biodiesel supply at that time, and the horizontal demand curve representing the price buyers would pay for the blended diesel product which is sold at the wholesale price of ultra-low sulfur diesel (ulsd) and is horizontal because the market price of ulsd is not affected by the substitution of petroleum diesel with biodiesel.
The two curves do not intersect, meaning that, in a free competitive market, the quantity of biobased diesel demanded and supplied would be zero.
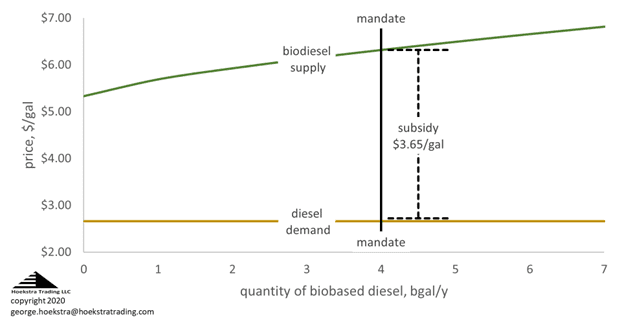
Figure 2. Bio-based diesel supply/demand example.
But Congress demanded that a certain quantity shall be supplied, which is represented by a vertical line segment at the government-mandated quantity, meaning that number of gallons will be demanded regardless of price; and they established the RIN credit system and other subsidies to ensure that will be accomplished.
So the vertical line segment is the effective demand curve for volumes less than the mandate and the dashed lines indicate the subsidy needed to bridge the gap between the ulsd price and the cost to supply bio-based diesel to replace cheaper gallons of petroleum diesel. Together, they can be viewed as a structure that supports the price being higher than the market demand price, forming what looks like the wall of a cliff at the mandated quantity.
Big difference
Our explanation for the nosedive can be pictured on the chart by downward movement in the supply curve, which reduces the gap that the RIN price must fill.
Our explanation for the nosedive can be pictured on the chart by downward movement in the supply curve, which reduces the gap that the RIN price must fill.
The RIN Cliff is different – it can be pictured on the chart by the wall of the cliff collapsing if the quantity supplied grows to levels beyond the mandated quantity.
The RIN Cliff is different – it can be pictured on the chart by the wall of the cliff collapsing if the quantity supplied grows to levels beyond the mandated quantity.
There is no provision for the RIN to subsidize any gallons supplied beyond the mandated quantity. If supply keeps growing beyond the mandate, in theory, the intrinsic value of the RIN will go to zero and then, in terms of the chart, the portion of the price support structure representing the RIN value will vanish which could create a big mess in the market.
It is easy to conflate these two different things – a falling supply curve is a common occurrence in most markets which results in smooth and familiar adjustments along continuous supply and demand curves causing things like the 2023 nosedive. The collapse of a price support structure is an uncommon occurrence that occurs in markets artificially propped up by price supports causing unfamiliar, discontinuous, sometimes spectacular step changes that blindside those not anticipating the cliff.
The collapse of a price support structure is an uncommon occurrence that occurs in markets artificially propped up by price supports causing unfamiliar, discontinuous, sometimes spectacular step changes that blindside those not anticipating the cliff.
The RIN cliff involves the crossing of a boundary, like a phase transition, where the rules change suddenly and market behavior can be completely different than it was within the previous boundaries, like when liquid water turns to steam, and like has happened several times in RIN history including when most of the market was blindsided by the D6 RIN price skyrocketing 100-fold (that’s 100-fold, not 100%!) in 2013.
OBJECTION!
This analysis does not account for the RIN carry-over bank, the RIN deficit carry-forward account, outstanding Small Refiner Exemption liabilities, imports, exports, the different equivalence values of different forms of bio-based diesel, the different categories of RINs, the nesting of those categories or changes in the bio-based diesel tax credit.
Objection sustained. It is true those are factors that must be accounted for when trying to predict the likelihood or timing of reaching the cliff which is worthwhile work. But that is not the purpose here. The purpose is to differentiate between a falling supply curve and a cliff which are two very different things that are otherwise easily conflated under the heading “RIN oversupply”.
OBJECTION!
This analysis does not account for the big changes in supply, demand, and price of the different feedstocks being used for production of biodiesel and renewable diesel.
Objection sustained. It is true those changes are important for understanding the details of the falling supply curve which is also worthwhile work. But it is not the purpose here. The purpose is to differentiate between a falling supply curve and a cliff.
OBJECTION!
The RIN price will not go to zero because the laws of economics say bio-based diesel supply will stop growing when the mandate is hit, therefore the cliff is an illusion.
Overruled: The laws of economics (unlike the laws of thermodynamics) are not always obeyed. Instead, they define what should happen if the assumptions made apply in the real situation. For many reasons, we do not believe renewable diesel production growth will cease immediately when the mandate is reached, as it should in an ideal free competitive market. And we do believe the intrinsic value of the RIN will collapse to zero if supply growth continues beyond the mandated quantity (adjusted for imports, exports, carryover banks and the like) in 2024 or 2025.
we do not believe renewable diesel production growth will cease immediately when the mandate is reached, as it should in an ideal free competitive market.
Conclusions
- The 2023 D4 RIN price nosedive was a change of the familiar continuous type
- The RIN cliff still looms as a possible future change of the unfamiliar, discontinuous, sometimes spectacular type that is caused by artificially-imposed boundaries and has blindsided RIN market participants in the past
- Differentiating the two is important to those with a stake in future RIN prices and who don’t want to be blindsided yet again in 2024 or 2025
Recommendation
Those with a stake in RINs pricing and economics should get Hoekstra Research Report 10 which includes the Attractor spreadsheet that calculates theoretical D4 RIN values using the Irwin-McCormack-Stock (IMS) RIN price model (black line on chart below) based on economic fundamentals, tracks them versus actual prices (silver and gold data points), predicts how the D4 RIN price will change with the variables that affect it, includes 6 months of unlimited consultation by phone and E-mail, and is available to anyone immediately at negligible cost.
It is not a monthly newsletter, it is a research report based on millions of dollars worth of academic work on RIN fundamentals that will give you a new perspective on RIN pricing and economics, unique insights and practical tools your company can use to better track, interpret and anticipate RIN price movements. Here’s the offer letter including the Table of Contents and a sample invoice with all the information needed to prepare a purchase order. Why not send a purchase order today?

Attractor update
The Hoekstra IMS RINs pricing spreadsheet shows the D4 RIN market price (gold and silver points) and the theoretical D4 RIN value updated through last Friday. The theoretical value of a hypothetical D4 RIN with 1 year remaining life is $0.66.

Hoekstra Trading clients use this spreadsheet to compare theoretical and market prices, analyze departures from theoretical value, and identify trading opportunities on the premise RIN market prices will be attracted toward their fundamental economic values.
George Hoekstra george.hoekstra@hoekstratrading.com +1 630 330-8159