Investment alternatives for clean gasoline production in a volatile fuels market
This economic analysis presents investment costs and returns for a hypothetical refinery with a 55,000 barrel/day fluid catalytic cracker (FCC) in a market that will adopt a new 30-ppm clean sulfur gasoline specification. The refinery’s current FCC naphtha, which has been suitable for use in gasoline, will then be too high in sulfur for that market. In addition, there is a possibility the 30-ppm sulfur specification will be tightened to 10 ppm in 7 years.
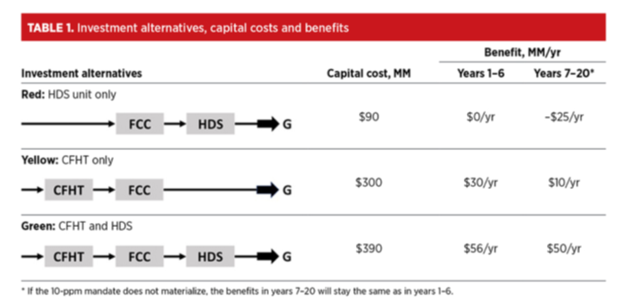
The analysis considers three FCC train configurations called the red, the yellow, and the green configurations, with capital investment costs and annual benefits shown in Table 1.
Table 1 Investment alternatives, capital costs and benefits
Red refinery investment
To meet the new 30 ppm sulfur specification, the refinery needs at least a gasoline hydrodesulfurization (HDS) unit, which costs $90 million. This is the red configuration. It will allow the refinery to stay in business producing 30 ppm sulfur gasoline and maintain its current gasoline sales and profit margin with the sulfur specification at 30 ppm. At year 7 there is a fork in the road – if, in year 7, the sulfur specification is tightened from 30 to 10 ppm, there will be a margin penalty of $25 million/y caused by additional octane loss in the HDS unit when pushing it to make 10 ppm sulfur gasoline:
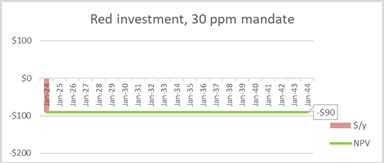
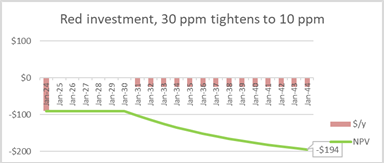
Figure 1 Cash flows and net present values for the red investment scenarios
The red investment can be viewed as a minimum compliance investment of $90 million required to maintain current business. It also carries a risk of $25 million/y profit loss in years 7-20, a contingency that would reduce its present value by $104 million from -$90 million to -$194 million.
Green refinery investment
An alternative is to build an HDS unit for $90 million and a cat feed hydrotreater (CFHT) for $300 million. This is the green configuration, with a total capital investment of $390 million. It would allow the refinery to meet the 30 ppm sulfur specification and deliver profit growth of $56 million/y by way of increased upgrade value in the FCC train. If, in year 7, the sulfur mandate is tightened to 10 ppm, the annual margin benefit will fall from $56 million/y to $50 million/y due to additional octane loss caused by increased severity on the HDS unit. Figure 2 shows the cash flow data and net present values for this investment:
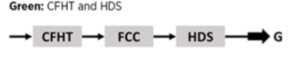
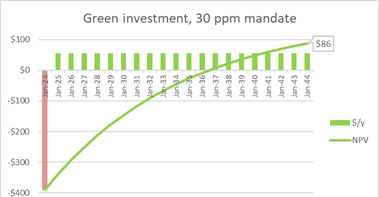
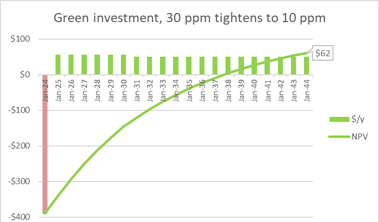
Figure 2 Cash flows and net present values for the green investment scenarios
The green investment can be viewed as a compliance investment plus a growth opportunity. Its net present value is $86 million which falls by $24 million to $62 million if the sulfur specification is tightened to 10 ppm in year 7.
Comparing investments with a real options perspective
Real options occur naturally as flexibility and growth opportunities that can be exercised over time in an environment of uncertainty. An oil refinery with the flexibility to switch inputs and outputs has an embedded real option to switch when crude price differentials or product values change or when diesel is in greater demand than gasoline. Flexibility increases the value of every asset under conditions of uncertainty.
Flexibility increases the value of every asset under conditions of uncertainty.
In our example, for the red investment, if the sulfur specification is tightened from 30 ppm to 10 ppm in year 7, the net present value falls by $104 million (from $-90 to $-194 million). By comparison, for the green investment, the tightened sulfur specification reduces the net present value by only $24 million, (from $86 to $62 million). The difference of $80 million is a measure of the payoff on a real option that goes “in-the-money” for the green refinery if the sulfur mandate is tightened to 10 ppm in year 7.
The difference of $80 million is a measure of the payoff on a real option that goes “in-the-money” for the green refinery if the sulfur mandate is tightened to 10 ppm
That option is embedded in the green refinery investment and stems from its flexibility to reduce the sulfur of its gasoline from 30 to 10 ppm at lower incremental cost than the red refinery.
Gasoline margin volatility
The above analysis focused on how changing sulfur specifications affect the economics of the red and green investments, and especially how those investments differ in their flexibility to respond to an uncertain future specification change. The analysis does not consider other uncertainties that would affect the green vs. red investment decision.
Perhaps the largest uncertainty is the overall level of gasoline margins in the market. The above “fixed benefit” analysis essentially assumes the overall level of gasoline margins will stay constant over time. The green investment would deliver a benefit of $56 million/y, which corresponds to $2.80/barrel of FCC feed, over what would otherwise occur. But to an investor who is bearish on gasoline margins, that $2.80/barrel benefit could easily be wiped out by declining gasoline market margins which would work against the higher cost green alternative. Similarly an investor who is bullish on gasoline margins would be even more inclined to make the green investment.
U.S. gasoline margins have in fact been unusually high and volatile in recent years.
U.S. gasoline margins have in fact been unusually high and volatile in recent years.
Figure 4 shows probability distributions derived from historical data on the price spread between West Texas Intermediate (WTI) crude oil and NYMEX front-month RBOB gasoline futures (RBOB stands for reformulated blendstock for oxygenate blending which is a gasoline product produced by refineries for blending with ethanol to make finished gasoline).
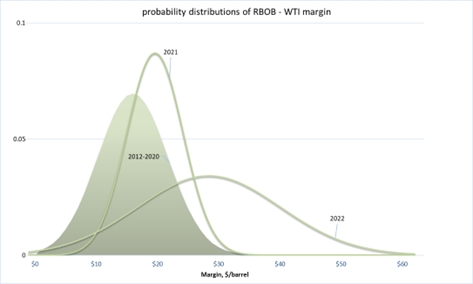
Figure 3Probability distributions for RBOB gasoline – WTI crude price differential
We will use this margin between RBOB and WTI price to represent the behavior of gasoline margins in the United States. Noteworthy points about Figure 3 are:
- The shaded distribution shows the margin during 2012–2020 was centered around $16.00/barrel and very rarely went as high as $30.00/barrel during that 8-year period.
- The 2021 distribution curve is centered on a mean of $21.60 per barrel, with a 1-year volatility similar to that of the previous 8 years combined.
- 2022 saw a spectacular increase in both the level and volatility of gasoline margin, with a mean of $30.40/barrel and a much broader range than all previous years.
This picture of increasing gasoline margin and margin volatility heightens the interest in considering margin volatility in refining investment analysis.
Value of flexibility
Margin volatility is important because refineries with flexibility can capture much higher margins in more volatile market environments. That is a key principle of real options — flexibility provides managers with real options to adjust operations in response to market changes as they occur; and the higher the volatility, the higher the value of those options.
Flexibility provides managers with real options to adjust operations in response to market changes as they occur; and the higher the volatility, the higher the value of those options.
What does this margin volatility mean for our example case of the green vs. red Tier 3 investment decision?
Suppose some combination of events causes gasoline market margins to increase. A red refinery, handcuffed by the limits of its FCC train, has little flexibility to adjust operations to capture higher margins when they arise. By contrast, the green refinery has many options to adjust. It can adjust CFHT severity to boost the FCC’s yield of low sulfur gasoline, it can feed higher sulfur feedstocks, coker gas oils, metal-containing feeds, and low-value intermediates to the FCC train when those feedstocks are cheap and crack them into fully valued Tier 3 gasoline, or it can make sub-10 ppm sulfur gasoline and generate sulfur credits at low cost for sale to refiners who have high incremental cost for sulfur reduction.
To factor margin volatility and flexibility into our investment analysis, we will treat the annual benefit of the green investment as an uncertain variable rather than a known constant. Consider the $56 million/y, or $2.80/barrel fixed benefit estimate as the expected value (mean) of a probability distribution that describes the green investment payoff in an uncertain margin environment. If we apply the variance rate of the 2012-2020 WTI-RBOB margin to represent the effect of other uncertainties on the market margin, the annual benefit from the green investment can be viewed as a normal probability distribution centered around $2.80/barrel (Fig 4).
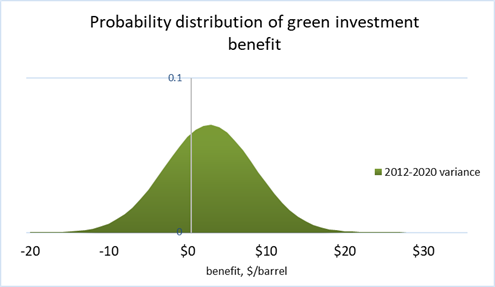
Figure 4 Probability distribution of the green investment benefit using 2012-2020 RBOB-WTI margin volatility
This indicates that margin volatility provides opportunity for upside benefits 4 times higher than the fixed $2.80/barrel estimated in the fixed-benefit analysis.
margin volatility provides opportunity for upside benefits 4 times higher than the fixed $2.80/barrel estimated in the fixed-benefit analysis.
Those upside benefits can only be captured by refineries with flexible FCC trains who make the necessary operational adjustments to move to the right of the curve and capture the high market margins when they occur.
The left side of Figure 4 shows the potential downside from falling gasoline margins, which could cause the investment payoffs to be less than $2.80/barrel, or even turn negative. But the green refinery has the option to throttle down the CFHT, or even idle it at times when net benefits are low. Notice that when the CFHT is idled the green investment reduces to the red investment. So it’s payoff is never less than the red investment.
Assuming the refiner exercises its real options to flex CFHT operations as gasoline margins change, including throttling down or idling the unit when called for, the actual payoff distribution for the green investment can be viewed as a truncated distribution:
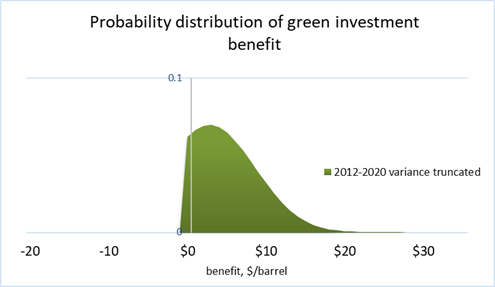
Figure 5 Truncated probability distribution of the green investment benefit using 2012-2020 RBOB-WTI margin volatility
This is equivalent to the payoff distribution of a stock option – the owner of an option is positioned to capture the upside benefits of a volatile stock with strictly limited exposure to its downside risk. Similarly, the flexibility of the green refinery provides a real option to capture the upside potential of a volatile gasoline margin environment with limited exposure to its downside risk.
the flexibility of the green refinery provides real options to capture the upside potential of a volatile gasoline margin environment with limited exposure to its downside risk.
The value of this real option can be quantified for any particular refinery using option pricing theory and that option value should be added to the fixed benefit estimate to give a more accurate picture of the payoff from the green investment.
An implication of the real options perspective is that higher gasoline margin volatility increases the value of the green investment, in the same way that higher stock price volatility increases the value of a stock option.
higher gasoline margin volatility increases the value of the green investment, in the same way that higher stock price volatility increases the value of a stock option.
We have seen these factors at play recently in refining operations and refining company earnings. Refining operations have flexed over wide ranges in response to unpredictable events that have shocked fuel markets in the last 3 years. And unusually high differences in fuel margin capture rates emerged in refiners’ 2021 and 2022 earnings reports. If you look closely, you will see that refiners with modern, flexible FCC trains are delivering higher refining margin capture rates than the others in today’s volatile fuel market.
Takeaways
This economic analysis shows that an FCC train configuration with both a CFHT and an HDS unit is the most profitable configuration for the Tier 3 world because of its capability to consistently make high yields of ultra-low sulfur gasoline from low value feedstocks. Additional value comes from its flexibility to adjust to changing product requirements and market margins. Gasoline margins and margin volatility have increased in the United States in recent years, to an extent that suggests a flexible CFHT-FCC-HDS configuration can capture margins 4 times higher than that indicated by a fixed benefit analysis. Refiners who have this flexibility and use it are the ones who are capturing full market margins in today’s volatile fuels market. This example demonstrates how margin volatility data and the theory of real options can be used in refining investment analysis to bring insight that informs decision-makers by showing the value of flexibility over a project’s life, an approach that will lead to better decisions in an industry with an uncertain regulatory environment and increasingly volatile input and output prices.
Recommendation
Every refining executive should have a comprehensive understanding of the technical, regulatory, and economic aspects of Tier 3 gasoline, the sulfur credit program and how they affect your business. Those wanting a quick education on the Tier 3 issue should get the short book, Gasoline Desulfurization for Tier 3 Compliance, which will make you an industry expert in a day. Once you have become expertly informed of the problem, you can save your team years of research by buying Hoekstra Research Report 8. We saw this problem coming, gathered the required data, ran the simulations and analyzed the results so you and your team can immediately initiate well-informed strategies. The report includes detailed pilot plant and commercial field test data, full detail of sulfur credit pricing, spreadsheet models to help improve gasoline optimization, investment decisions, sulfur credit strategy and refining margin capture in the Tier 3 world.
Don’t get caught panic buying after the credits spike.
George Hoekstra
George.hoekstra@hoekstratrading.com
+1 630 330-8159