Modeling RINs as an option – Part 1
Also see Part 2 of this series
This chart shows the price of D4 Renewable Identification Numbers (RINs) traded in 2012 and 2013. The data is from the EPA’s Moderated Transaction System.

RINs expire at the end of the year following the calendar year of their creation. In Figure 2, the silver data points represent RINs that expire at the end of that trading year (2011 vintage RINs traded during 2012, and 2012 vintage RINs traded during 2013).
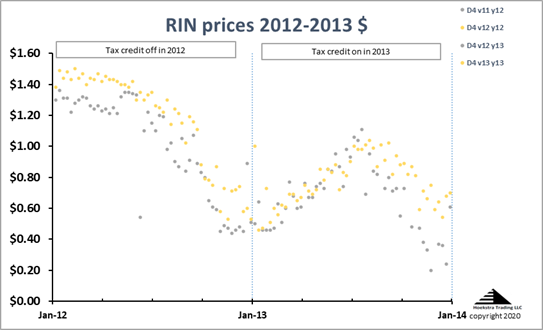
The gold data points represent RINs that expire at the end of the year following that trading year (2012 vintage RINs traded during 2012, and 2013 vintage RINs traded during 2013):
Differentiating the RINs this way shows the longer-term (gold) RINs traded at higher prices than shorter-term (silver) RINs. This is expected from financial economics theory.
Differentiating the RINs by expiration date shows the longer-term (gold) RINs traded at higher prices than shorter-term (silver) RINs, as expected from financial economics theory.
Also, at the top of Figure 2, we have noted that the $1.00/gallon biodiesel tax credit was not in effect during the trading year 2012, and was in effect during 2013.
Modeling RIN prices
Hoekstra Trading’s RIN pricing spreadsheet applies the IMS (Irwin-McCormack-Stock) D4 RIN pricing model to calculate the D4 RIN price based on economic fundamentals. The RIN can be modeled as an option because its value at expiration is known to be either the difference between the biodiesel and diesel prices (if positive), or zero otherwise. This boundary condition is what defines an option. The IMS model defines the RIN price using this known boundary condition and a Gaussian distribution for the biodiesel minus diesel price difference.
The RIN can be modeled as an option.
The IMS model also accounts for the effect of the $1.00/gallon blender’s tax credit which reduces the price differential that determines the RIN’s fundamental value.
The model also accounts for the blender’s tax credit.
The biodiesel tax credit has a history of being on some years and off other years, which introduces another source of uncertainty for RIN pricing. In the IMS model, this uncertainty is represented by two model parameters, q and p, where q is the probability the blender’s tax credit will stay off given it is off the current year, and p is the probability it will stay on given it is on the current year.
Applying the IMS model to 2012-2013 prices
In 2012, the biodiesel tax credit was off, and in 2013 it was on again. For the trading year 2012, if we set q = 1.0, meaning the market expected the credit to stay off through the life of the RINs, the model-calculated theoretical prices for the 2011 (silver) and 2012 (gold) RINs are as shown by the lines in Figure 3 below:
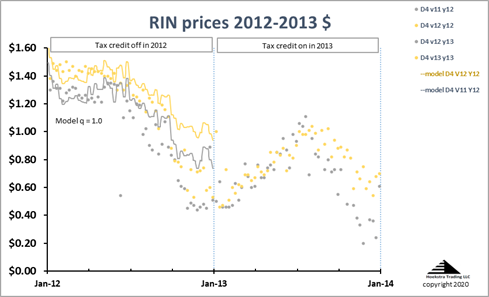
Notice first that the model predicts a higher price for the long-term (gold) RINs than the short-term (silver) RINs. This is consistent with the actual data and with options pricing theory. Inspection of Figure 3 shows the size of the model-calculated gold minus silver price spread is also consistent with the size of the spread between the gold and silver data points.
The model predicts a higher price for long-term (gold) RINs than short-term (silver) RINs, consistent with the actual data.
This is clear, direct evidence of the applicability of the option pricing theory.
Also from Figure 3, we see with q=1.0, the model is near the data in the first half of 2012, but far above the data at the end of 2012.
Changing expectations about the blender’s tax credit
If we now set the parameter q = 0.4, meaning the market is pricing in only 40% likelihood the credit will stay off, both model lines shift down, far below the corresponding data at the start of 2012, and near the data at the end of 2012, Figure 4:
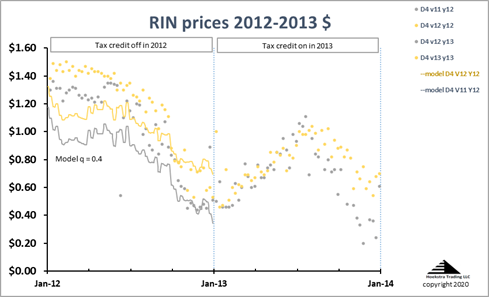
In fact, the credit was restored in January 2013, retroactively for 2012 and also for 2013, a change that had been increasingly anticipated during the course of 2012. So the price data, the historical facts, and the theoretical model all support this theory.
The price data, the historical facts, and the theoretical model all support the theory that the RIN market in 2012 was pricing in an increasing likelihood the credit would be restored.
Conclusions
This analysis of 2012 D4 RIN price data shows that:
- Differentiating RIN prices by expiration date reveals that long-term RINs traded at higher prices than short-term RINs which is clear evidence that option pricing theory, as applied in the IMS model and the Hoekstra Trading RINs pricing spreadsheet, applies to real-world RIN price data.
- The 2012 D4 RIN price data is consistent with the theory that the market’s expectation in 2012 shifted from near certainty the biodiesel blender’s tax credit would stay off to a 40% probability it would stay off.
- The Hoekstra IMS RINs pricing spreadsheet can be applied to accurately calculate RIN prices and quantitatively interpret RIN price dynamics.
The Hoekstra IMS RINs pricing spreadsheet can be applied to accurately calculate RIN prices and quantitatively interpret RIN price dynamics.
Recommendation
Anyone with a stake in RINs pricing and economics should get Hoekstra Research Report 10 which includes the Hoekstra ATTRACTOR spreadsheet spreadsheet that accurately calculates D4T, the theoretical RIN price, tracks it versus quoted market prices, and predicts how RIN prices will change with the variables that affect them. Why not send a purchase order today?
George Hoekstra george.hoekstra@hoekstratrading.com +1 630 330-8159
Anyone with a stake in RINs pricing and economics should get Hoekstra Research Report 10