D4-D6 Renewable Identification Number (RIN) Price Separation
The RIN system is a price control system that can be represented on a chart showing supply curves, demand curves, and constraints that form boundaries within the system. These curves and constraints can sometimes cause RIN prices to interact in peculiar ways that are predictable based on economic fundamentals.
When a boundary is crossed, RIN prices can change abruptly.
Boundaries affecting the D6 RIN include the blend wall (a vertical line at the maximum volume of ethanol in E10), the renewable fuel mandate volume and the advanced mandate volume (two other vertical lines on the map), the supply curves for ethanol and refinery gasoline (both upward sloping to the right) and the demand curves for E10, E15 and E85 (all downward sloping to the right). These boundaries all pass through and around the “gasoline neighborhood” on the RIN map which can lead to surprising, discontinuous movements.
The D6 RIN is especially vulnerable to surprising, discontinuous movements.
Here is one example simulation showing how the D6 RIN might separate from the D4 in coming weeks and months:
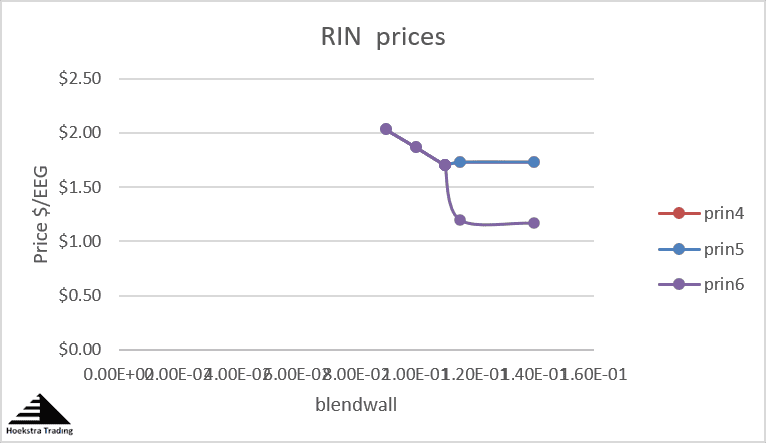
Other possibilities lead to different separation outcomes. All of them can be simulated quantitatively using the ATTRACTOR 2.0 spreadsheet which is a fundamental economic model of the RIN price control system that Hoekstra Trading has implemented in EXCEL.
Recommendation
You should get Hoekstra Research Report 10 which includes the Attractor RINs pricing spreadsheet and six months of unlimited consultation and is available to anyone immediately at negligible cost. Why not send a purchase order today?
Anyone with a stake in RINs pricing and economics should get Hoekstra Research Report 10
