Renewable Diesel In The News – Part 3, A Renewable Wreckoning?
This is Part 3 of a 4-part series reviewing my notes from a December 15, 2023 presentation made by Scott Irwin Professor of Economics, at the University of Illinois, titled “The RFS, Renewable Diesel, SAF & the Future of Biofuels”.
Read more blogs from this series Renewable Diesel in the News –
- Part 1 Two Ways To Skin A Fat
- Part 2 What The Investment Bankers Missed
- Part 3 A Renewable Wreckoning?
- Part 4 Critique Of The C-Suites
Part 1 gave some basic facts about the biomass based diesel industry. Part 2 explained biomass-based diesel economics using a supply demand chart which features an L-shaped demand curve which leads to the strange implication that the minimum size of the market is also it’s maximum size. This part 3 addresses the consequences of the strange situation where the minimum equals the maximum, and next week’s final part 4 will include two provocative questions I asked Scott from the floor of the conference that day.
Minimum = maximum
The minimum size of the market is defined by the Renewable Fuels Standard’s minimum volume mandate which can be calculated, for biomass-based diesel to be around 4.5 billion gallons/year for the years 2024-2025. That means the vertical segment of the L-curve is at x= 4.5 billion on the chart. According to the supply/demand chart analysis discussed in part 2 of this review of Scott’s presentation, that is also the theoretical maximum. But the current biomass-based diesel production capacity already exceeds that 4.5 billion maximum, and the scheduled pace of capacity expansion indicates growth to 7.4 billion within 2 years.
Houston we have a problem
Something must give. We are racing toward a situation where the industry production capacity will far exceed the maximum size of the market.
What exactly does that mean, to exceed the maximum size of the market?
First, we must recognize this maximum applies to the combined biodiesel plus renewable diesel market.
Second, we must recognize this maximum is neither a physical maximum nor a legal maximum but an economic maximum. The consequences of crossing the boundary into the region right of the L-curve are financial consequences of interest to those affected by or accountable for the financial health of biomass-based diesel suppliers, namely, the executives of those companies, their financiers, employees, shareholders, and others with an interest in the financial health of their production operations, and to any others whose profits or other forms of well-being depend on RIN prices.
Third, we must recognize the key difference between this situation and a normal market is that the boundary defining this economic maximum is a discreet boundary, like a wall or a cliff, whereas in normal markets, it is a continuous path along a smooth downward sloping demand curve. That means we should expect the consequences of crossing the boundary to be quite different than the familiar consequences of overbuilding capacity in a normal market. It is not just another case of overbuilding. It leads toward an economic reckoning unlike what is seen in normal markets.
Beyond this description, the differences between falling off this economic cliff and sliding down a normal demand curve were not covered in Professor Irwin’s December 15, 2023 talk. They are discussed in his series of 12 articles on the renewable diesel boom published starting in February 2023, in several published Hoekstra Trading articles starting in June 2023, and in Hoekstra Trading’s annual Research Reports.
Oh, Baby!
The following excerpts are from Part 1 of Hoekstra Trading’s 4-part blog series titled “Baby the RIN Must Fall” which was first published Jun 12, 2023 (that was 3 full months before the RIN fell, Baby). They elaborate on what falling off an economic cliff might look like, with reference to the crashing into the “ethanol blend wall” which is an analogous crossing of an economic boundary ten years ago. Quote:
Refiners first felt the strong grip of the government RFS mandates in 2013. Before then, refiners could meet most of their RFS volume obligations by blending ethanol into gasoline. That was painless because ethanol provided a valuable octane boost, enough that ethanol was earning its way into the gasoline supply chain on economic grounds, even without a subsidy. At that stage, it was very much like a free market. But in January, 2013, the market ran full speed into a boundary commonly called the “ethanol blend wall”. . . .
Pausing momentarily from the pull-quotes, we have referred to the crashing into the blend wall as the Big Bang”. Now, returning to the pull quotes from “Baby the RIN Must fall”:
. . . .The 2013 Big Bang is pertinent to today’s topic because the possibly imminent RIN crash event would be much like replaying the Big Bang in reverse 10 years later, in the sense that refiners would be released from the government control that first gripped them in 2013. . . .
. . . . Today’s chatter is that rapid growth of hydrogenated renewable diesel has drawn the biomass-based diesel market to the edge of another threshold event that would release it from the grip of the binding RFS government mandate and place it back into control of the free market. . . .
. . . . When that threshold is crossed, by definition, no RIN subsidy will be needed to meet the minimum supply mandate. And, as explained in our RBN Misunderstanding series and Land of Confusion drill down report, published by RBN Energy, when no subsidy is needed, the price of the RIN goes to zero.
George hoekstra, from “baby the rin must fall”, june 12, 2023
The above series of pull-quotes is selected to emphasize that crossing discreet boundaries, like those defined by the legs of an L-curve curve, or a wall, or a cliff, leads to discontinuous changes like the 100-fold (that’s 100-fold, not 100%!) increase in the D6 RIN price in 2013 which was aptly described back then as crashing into an economic wall. Similarly, the discontinuous change we are now approaching, and may cross in 2024 or 2025, can be (and has been) aptly described (by Scott Irwin) as falling off an economic cliff.
Returning now to my notes from Scott Irwin’s presentation, I was in the audience at the conference and, after his presentation, I asked Professor Irwin two questions that were on my mind, which will be covered in the 4th and final episode of this series next week.
Recommendation
Anyone with a stake in RINs pricing and economics should get Hoekstra Research Report 10 which includes this Hoekstra IMS RINs pricing spreadsheet that accurately calculates theoretical RIN prices, tracks actual prices, and predicts how RIN prices will change with the variables that affect them. Why not send a purchase order today?
Anyone with a stake in RINs pricing and economics should get Hoekstra Research Report 10
Attractor update
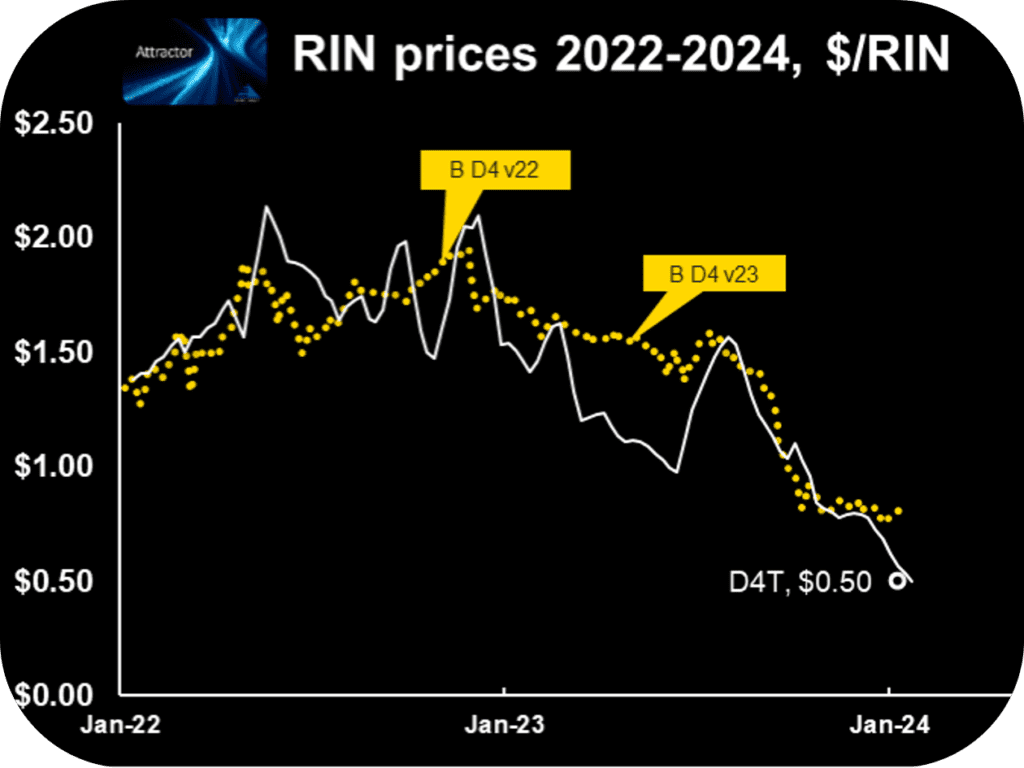
The Attractor spreadsheet shows the D4 RIN market price (gold points) and the “D4T” theoretical value (white line and open white data point) updated through last Friday. The theoretical value of a hypothetical D4 RIN with 1 year remaining life (“D4T”) is $0.50 which is down 6 cents from last week and 31 cents below the most recent quoted market price of $0.81
Hoekstra Trading clients use this spreadsheet to compare theoretical and market prices, analyze departures from theoretical value, and identify trading opportunities on the premise RIN market prices will be attracted toward their fundamental economic values.
Get the Attractor spreadsheet, it is included with Hoekstra Research Report 10 and is available to anyone!

George Hoekstra george.hoekstra@hoekstratrading.com +1 630 330-8159