Renewable Diesel In The News – Part 2, What The Investment Bankers Missed
This is Part 2 of a four-part series reviewing my notes from a December 15, 2023 presentation made by Scott Irwin, Professor of Economics at The University of Illinois, titled “The RFS, Renewable Diesel, SAF & the Future of Biofuels”.
Read more blogs from this series: Renewable Diesel in the News:
- Part 1 Two Ways To Skin A Fat
- Part 2 What The Investment Bankers Missed
- Part 3 A Renewable Wreckoning?
- Part 4 Critique Of The C-Suites
Part 1 provided some basic facts about renewable diesel and the enormous boom that is occurring in renewable diesel production. This Part 2 explains what’s driving the boom and points to a key insight missed by investment bankers who funded it. Part 3 is here. The series leads up to two provocative questions I asked Scott from the conference floor (Part 4).
Policy stack
What is behind the renewable diesel boom? It is the policy stack. That is investment banker lingo for the collection of subsidies that bridges the gap between the cost to produce bio-based diesel and its value in the market.
Without subsidies, renewable diesel is not economically viable. The product will not sell at any price higher than the price being paid in the market for petroleum-based ultra-low sulfur diesel (ulsd).
But the feedstock cost alone already exceeds that price, even before considering other costs to produce and the capital charges for the huge investments involved in converting refinery units to renewable diesel production ($100s of millions of investment per plant).
And the renewable diesel boom has increased demand for renewable feedstocks by several-fold, driving feedstock costs even higher with no corresponding change in product value, further increasing the gap between the cost to supply and the market price of the product diesel.
So why are we seeing this enormous boom in renewable diesel production?
Stacked deck
Investment bankers talk about the policy stack which refers to the stack of subsidies available to suppliers. If and when that stack exceeds the gap between the cost to supply and the demand price, suppliers have a chance to earn a profit making and selling renewable diesel despite the upside down economics. So it is all about government policy. Without government policy incentives, none of it sells.
How has the government stacked the deck?
First and most important is the Renewable Fuel Standard which provides minimum volume mandates for biofuel use and forms the foundation of the stack.
Second is the U.S. Blender’s Tax Credit which gives a $1/gallon credit to those who blend bio-based diesel into diesel. It will be converted to a new form based on the biofuel’s carbon intensity score after 2024.
Third is high import tariffs on the biggest U.S. import competitors for FAME biodiesel.
Fourth are state FAME biodiesel mandates in a variety of forms.
Fifth are state carbon fuel credits like California’s Low Carbon Fuel Standard (LCFS) that offer variable incentives for supplying biofuels into a state’s fuel market.
This is an impressive policy stack that is 100% the financial foundation for the renewable diesel boom.
If you take any of these components away, it doesn’t work.
So where are things headed?
The Irwin L-curve
Buckle up because we are about to discuss a supply and demand chart using a graph of price (y-axis) versus quantity (x-axis).
The supply and demand chart for bio-based diesel shows a horizontal demand curve at y = the price of ulsd for all quantities produced, indicating that, as renewable diesel production grows, the value received for the product (the demand price) is unaffected by that growth.
And the supply curve shows the cost to supply which is an upward sloping curve that is, at all points, way above that demand price, for any quantity supplied. It is upward sloping because the incremental cost to produce an additional gallon increases with production volume.
If you picture that chart in your mind, a horizontal line and an upward sloping curve which is at all points above it, you can see there is no point of intersection (where supply and demand are equal), meaning that, left to the workings of a free market economy, the quantity of bio-based diesel produced and consumed is a big fat zero.
But the U.S. Congress demanded, in the Renewable Fuel Standard, that a certain minimum volume of bio-based diesel shall be demanded regardless of price. That mandate can be represented by a vertical line at x = the mandated quantity to be produced this year.
That vertical line is the effective demand curve for bio-based diesel for production volumes up to the mandate, and it does intersect the upward sloping supply curve at a price much higher than the price of ultra-low sulfur diesel.
Meanwhile, the horizontal segment of the demand curve at y = the price of ulsd remains applicable for production volumes above the mandate; hence, with the deck stacked this way in favor of bio-based diesel, the effective demand curve is L-shaped.
The demand curve for bio-based diesel is L-shaped
Scott IRWIN
And, with this L-shaped demand curve, there is a price where supply = demand.
Enter the RIN
As part of the Renewable Fuel Standard, there exists a type of environmental credit called the Renewable Identification Number (RIN) which was cleverly designed such that its value varies to fill the supply/demand gap and whose price is set by supply and demand for the RIN. To discuss how that works is a deep wormhole we will not go down today. Just know that when you set a mandate way above what the market wants, the RIN price will be positive.
A chart of RIN price for renewable diesel shows its value has been volatile, varying over a range from $0.50 to $2.00 since 2009. The fact that is has been positive that whole time is a message from the market saying, in the real world, we have been operating on that vertical segment of the L-shaped demand curve.
Artificial minimum = economic maximum
Here is the money point for today: We usually think a mandate defines a minimum – and in this case it does. But, in this case, the RFS mandate also defines a maximum or a ceiling. There is no market incentive for anybody to go above the mandated volume. That is what all the investment bankers missed.
The RFS minimum mandate also defines an economic maximum or a ceiling. There is no market incentive for anybody to go above the mandated volume.
Scott Irwin
So we have a market where the deck has been cleverly stacked to create a funny L-shaped demand curve, and the market price of RINs is telling us we have been operating on the vertical leg of the L-curve for 15 years, which says the minimum production quantity is also a maximum, which is a point the investment bankers missed. So what? What’s abnormal about the energy industry overbuilding and then letting markets re-equilibrate and move along? But an L-shaped demand curve raises a new question which is what would happen in this market if production volume grew by enough to cross the boundary to the region right of the vertical leg of the L? Crossing the boundary of an L-shape demand curve is abnormal, and the region to the right is uncharted territory where we should expect abnormal behavior, a topic to be covered in next week’s Segment 3 of this 4-part blog series.
Attractor update
The Attractor spreadsheet shows the D4 RIN market price (gold points) and the “D4T” theoretical value (white line) updated through last Friday. The theoretical value of a hypothetical D4 RIN with 1 year remaining life (“D4T”) is $0.56 which is down 8 cents from last week and 24 cents below the most recent quoted market price of $0.80
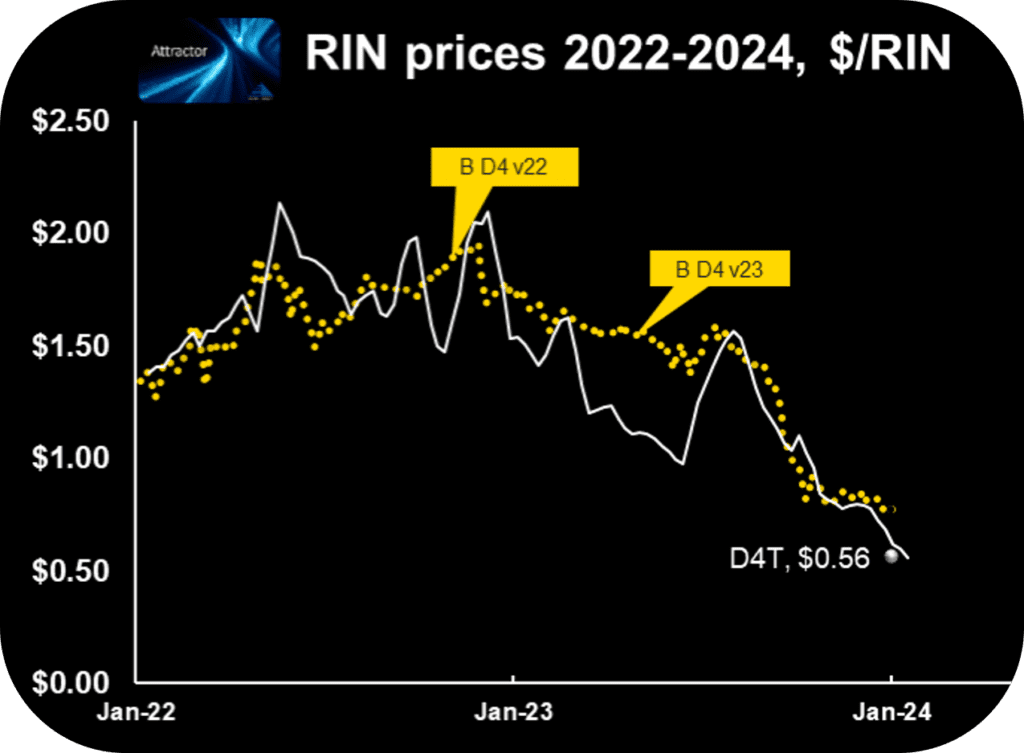
Hoekstra Trading clients use this spreadsheet to compare theoretical and market prices, analyze departures from theoretical value, and identify trading opportunities on the premise RIN market prices will be attracted toward their fundamental economic values.
Get the Attractor spreadsheet, it is included with Hoekstra Research Report 10 and is available to anyone!
George Hoekstra george.hoekstra@hoekstratrading.com +1 630 330-8159