RIN Price Nosedive Part 4 – A Nosedive Is One Thing, A Cliff Is Another
In theory, a higher price for a commodity will attract new suppliers into the market who would not be profitable at a lower price. For that reason, a chart of “supply price” versus “quantity supplied” is upward sloping from left to right. Conversely, a higher price will chase away some consumers for whom the product isn’t worth paying the higher price, and so a chart of “demand price” versus “quantity demanded” is downward sloping from left to right.
Read other blogs from this series RIN Price Nosedive:
- Part 1 C-Suites Questioned On RIN Price Nosedive
- Part 2 Was It Foreseen, What Was The Cause, Will It Continue?
- Part 3 It Was Foreseen, It’s Cause Was Competition, And it Will Continue
- Part 4 A Nosedive Is One Thing, A Cliff Is Another
- Part 5 Dissecting the 2023 RIN Price Nosedive

If you picture that in your mind, an upward sloping “supply curve” and a downward sloping “demand curve”, you can see that, if the upward sloping supply curve is moved down, the point where the 2 curves intersect will also go down. The point where they intersect is the “market clearing price”, where quantity supplied = quantity demanded, and supply price = demand price.
That is Hoekstra Trading’s theory for why the D4 RIN price nosedived from $1.60 to $0.80 this year. Low-cost renewable diesel supply has been driving higher-cost biodiesel suppliers out of the market, meaning the industry’s cost to supply bio-based diesel (the supply curve) has shifted down.
A kink
But there is a kink in this picture when applied to the biobased diesel market – that’s because, in this market, there is no point of intersection of the supply and demand curves because the cost to supply bio-based diesel exceeds anyone’s willingness to pay when they can buy much cheaper petroleum diesel instead. That is to say, left to consumer choice, the quantity of biobased diesel demanded = zero even at the cheapest cost to produce. And, if you stick with me and picture this in your mind on our y (price) versus x (quantity) chart, that says the demand curve for biodiesel is a vertical line at quantity x = 0, regardless of price, instead of the usual downward sloping curve that describes normal consumer demand.
But Congress gave us a mandate demanding that a certain minimum quantity SHALL BE demanded. And EPA decided that means the market quantity demanded will be (please stick with me), a vertical line at quantity equals, roughly, for today’s purpose, 4.5 billion gallons, instead of at quantity=0.
Now our mental picture shows a vertical demand curve at x (quantity) = 4.5 billion gallons regardless of price, and an upward sloping supply curve that defines the cost for the industry to supply different quantities of bio-based diesel. Those 2 lines do intersect, at a quantity of 4.5 billion gallons and some price that depends on the position of the upward sloping supply curve.
And, if you stuck with me, you will see that, as the cost to supply (supply curve) moved down in 2023 (because of renewable diesel replacing biodiesel), so did its point of intersection with the vertical demand curve. And that is our theory on what happened in 2023. The supply curve shifted down and took the D4 RIN price with it.
Other theories have been offered, like the war in Ukraine, changes in imports, exports, the RIN bank, and EPA’s actions. Those may have contributed, but we believe the main cause was a supply curve downshift caused by substitution of biodiesel with renewable diesel.
The downshift theory is strongly supported by the fact that it fits in a quantitative way; that is, if we draw the chart with real-life numbers on the price and quantity axes and apply our fundamental ATTRACTOR RIN pricing model, the implied price of the D4 RIN not only goes in the right direction (down) it goes by the right amount (from $1.60 to $0.80). The same cannot be said for the War in Ukraine theory. That’s the value of a quantitative, fundamental model versus a qualitative mental picture.
A cliff
Finally, the above picture describes a nosedive caused by a downward shift in the supply curve. That nosedive was not a cliff, it was a steep but smooth ride along an inclined path. Except for it occurring along a vertical demand curve (which is abnormal), it was no different from what would happen in a normal commodity market.
The cliff is very different. It describes what will happen if the quantity supplied keeps growing beyond the the artificially imposed demand defined by the mandate. To envision that, refer back to the mental picture and ask what happens when x (quantity supplied) reaches the vertical line at x=4.5 billion gallons and then continues growing because producers keep pumping out biodiesel gallons beyond the mandate. That is something different, where the bottom falls out, something that has been aptly named the RIN cliff by Scott Irwin and we will discuss that more in a future episode of this weekly blog.
Conclusions
- The main cause of the 2023 D4 RIN price nosedive was the replacement of high-cost biodiesel supply with lower cost renewable diesel supply.
- This supply downshift theory fits the reduction in nosedive altitude quantitatively.
- The RIN Cliff is something different which still looms as a possibility for 2024 and 2025
Recommendation
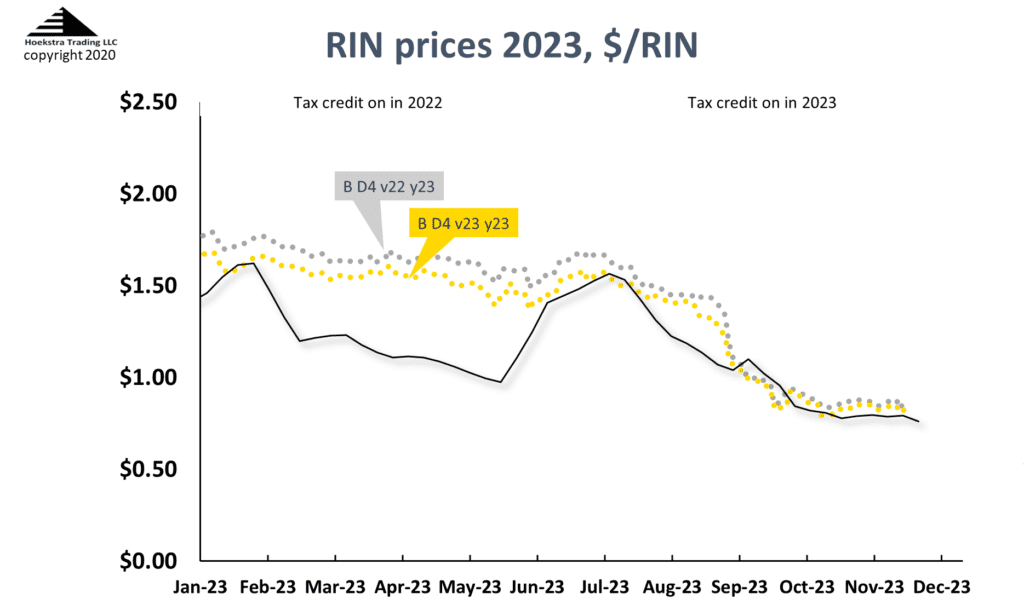
Those with a stake in RINs pricing and economics should get Hoekstra Research Report 10 which includes the Attractor spreadsheet that calculates theoretical D4 RIN values using the Irwin-McCormack-Stock (IMS) RIN price model (black line on chart below) based on economic fundamentals, tracks them versus actual prices (silver and gold data points), predicts how the D4 RIN price will change with the variables that affect it, includes 6 months of unlimited consultation by phone and E-mail, and is available to anyone immediately at negligible cost.
It is not a monthly newsletter, it is a research report based on millions of dollars worth of academic work on RIN fundamentals that will give you a new perspective on RIN pricing and economics, unique insights and practical tools your company can use to better track, interpret and anticipate RIN price movements. Here’s the offer letter including the Table of Contents and a sample invoice with all the information needed to prepare a purchase order. Why not send a purchase order today?
Attractor update
The Hoekstra IMS RINs pricing spreadsheet shows the D4 RIN market price (gold and silver points) and the theoretical D4 RIN value updated through last Friday. The theoretical value of a hypothetical D4 RIN with 1 year remaining life is $0.76.
Hoekstra Trading clients use this spreadsheet to compare theoretical and market prices, analyze departures from theoretical value, and identify trading opportunities on the premise RIN market prices will be attracted toward their fundamental economic values.
George Hoekstra george.hoekstra@hoekstratrading.com +1 630 330-8159