RIN Price Nosedive Part 5 – Dissecting The 2023 RIN Price Nosedive
The ATTRACTOR RIN price model is a spreadsheet that calculates the theoretical value of the D4 Renewable Identification Number (RIN) and enables users to study theoretical vs. market RIN prices. The theoretical value is calculated using Hoekstra Trading’s spreadsheet application of the Irwin-McCormack-Stock (IMS) pricing model which is based on fundamental economic theory.
Read other blogs in this series, RIN Price Nosedive:
- Part 1 C-Suites Questioned On RIN Price Nosedive
- Part 2 Was It Foreseen, What Was The Cause, Will It Continue?
- Part 3 It Was Foreseen, It’s Cause Was Competition, And it Will Continue
- Part 4 A Nosedive Is One Thing, A Cliff Is Another
- Part 5 Dissecting the 2023 RIN Price Nosedive
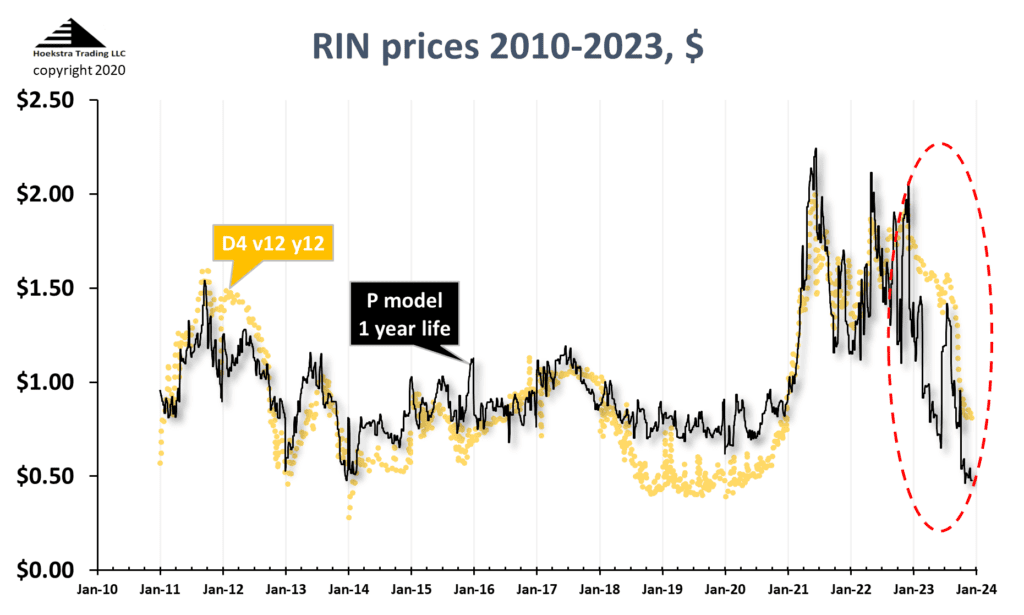
The black line is the theoretical value and the gold points are the D4 RIN market price. The model does a good job explaining major market price movements over the entire 13-year history of the RIN, with periods of significant separation between theoretical and market prices. Hoekstra Trading clients have proven, through 3 years of successful use, that quantitative analysis using this spreadsheet lays solid ground for winning RIN strategies.
The nosedive
The last year’s price action, highlighted in red, shows the 2023 RIN price nosedive. From January, Hoekstra Trading clients were discussing and analyzing the growing gap between the theoretical (black) and market (gold) prices. Starting in February, a series of 12 articles on renewable diesel supply was published by Scott Irwin’s team of economists at University of Illinois, giving quantitative supply/demand analyses and explanations of the theory behind a possible D4 RIN price crash.
During the summer, a buzz grew through the trading community and media, including my series of articles titled “Baby the RIN Must Fall – A Decade After the Big Bang, are RIN Prices Headed for a Crash?” which was published in 3-parts in the RBN Energy Daily Blog starting in June.
The buzz grew louder with several widely-published estimates of bio-based diesel and RIN supply and demand balances, and C-Suite executives were asked about RIN over-supply by financial analysts in 2nd and 3rd quarter earnings conference calls. The questions were along the lines, was the RIN crash foreseen?, what was the cause? and will it continue?
Reliable ATTRACTOR
Users of the ATTRACTOR spreadsheet always know why the black line is moving where it is. That’s because we are calculating that black line each week. If it goes down by 10 cents in a week, we only need to examine which numbers in the formulas changed to cause that drop.
Another ATTRACTOR advantage is we don’t need to know every supply/demand number to calculate the RIN price. That’s because many of the factors that affect the RIN price are implicit in one or more of the variables in the formulas. Knowing those fundamental variables that directly affect the RIN price is enough to calculate the theoretical price. If you want to go deeper to study what’s happening underneath, you can.
Another advantage is the ATTRACTOR spreadsheet quantifies the effects of those fundamental variables on the RIN price. So instead of having dozens of supply/demand numbers and no way to calculate the implied RIN price itself, you have a number for the RIN price itself and a method to examine and study which factors drove it to change.
These advantages come with use of a fundamental, quantitative theoretical pricing model. From inspection of the ATTRACTOR chart, it is obvious the theoretical and market prices don’t always match. The interesting cases are when there’s big differences. Those cases justify close examination where you go down a layer or two to identify possible explanations for the cause. Three years of experience using this method has shown it is good to expect a tendency for the market price to be attracted back toward its theoretical value, which is why we named the black curve, and the spreadsheet, ATTRACTOR.
The 2023 RIN price nosedive was unquestionably foreseen.
Our explanation of its cause was that the growth of hydrogenated renewable diesel production, in competition with fatty acid methyl ester (FAME) biodiesel, caused a shift in the bio-based diesel supply curve that reduced the incremental cost of bio-based diesel; and this competition meant the RIN price necessary to subsidize the production of bio-based diesel, other things equal, must fall by the amount it did.
Our projection is the supply curve will continue to move down as competition continues to intensify on the supply side of the bio-based diesel market.
This review of three recent weekly blog posts (on the model, the nosedive, and the cause) addresses what we’ve called the nosedive, which is something different from the RIN Cliff. Next week’s blog post will address that difference.
Recommendation
Get Hoekstra Research Report 10 which includes the Attractor spreadsheet.